bad chart thursday
-
Random Asides
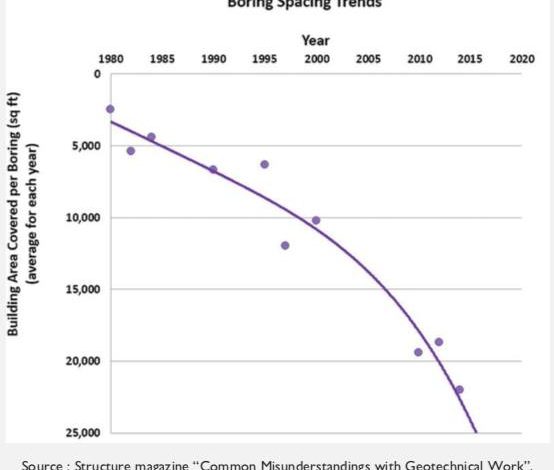
BCT: A Boring Boring Chart
This week’s post is a brief and uneventful break from all the digital BS we wade through every day lately. It comes from the Upside Down a published source, a magazine for structural engineers, who apparently read with mirrors while standing on their head. Behold, the Boring Spacing Trends chart! At first glance, the years being at the top instead…
Read More » -
Politics
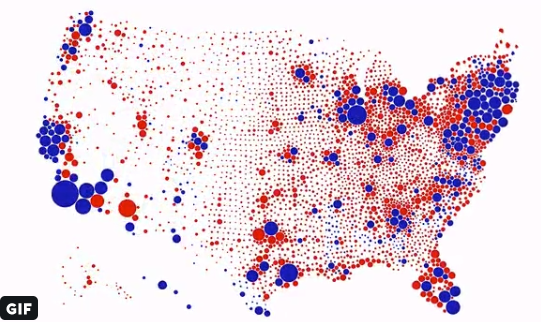
What the Hell Happened to Bad Chart Thursday?
Bad Chart Thursday, for me, has always been about examining through satire how people and organizations mislead, through charts or through ideas I can illuminate as nonsense simply by charting the logic. But satire has become really difficult to write lately, with reality repeatedly seeming like an Onion headline. And every day, there are serious issues going on that are…
Read More » -
Feminism
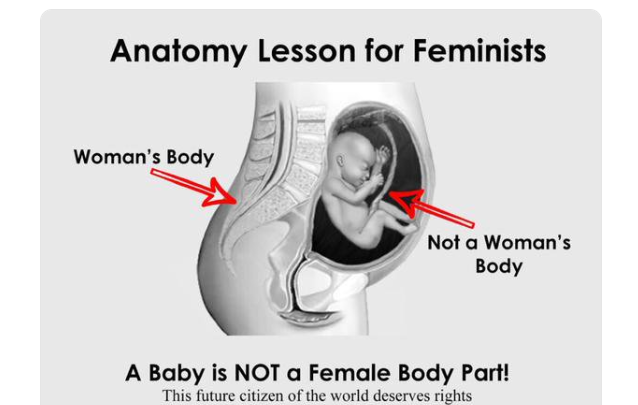
Bad Chart Thursday: “Anatomy” Lesson for Feminists
Complete, often willful, ignorance of biology is characteristic of the anti-choice forced birth movement, perhaps even more characteristic than religious faith. Yet this ignorance is equally fanciful, imagining fully formed babies inside women (often inside our stomachs, apparently), rape never leading to pregnancy because “the female body has ways to shut the whole thing down,” embryos and fetuses magically feeling…
Read More » -
Anti-Science
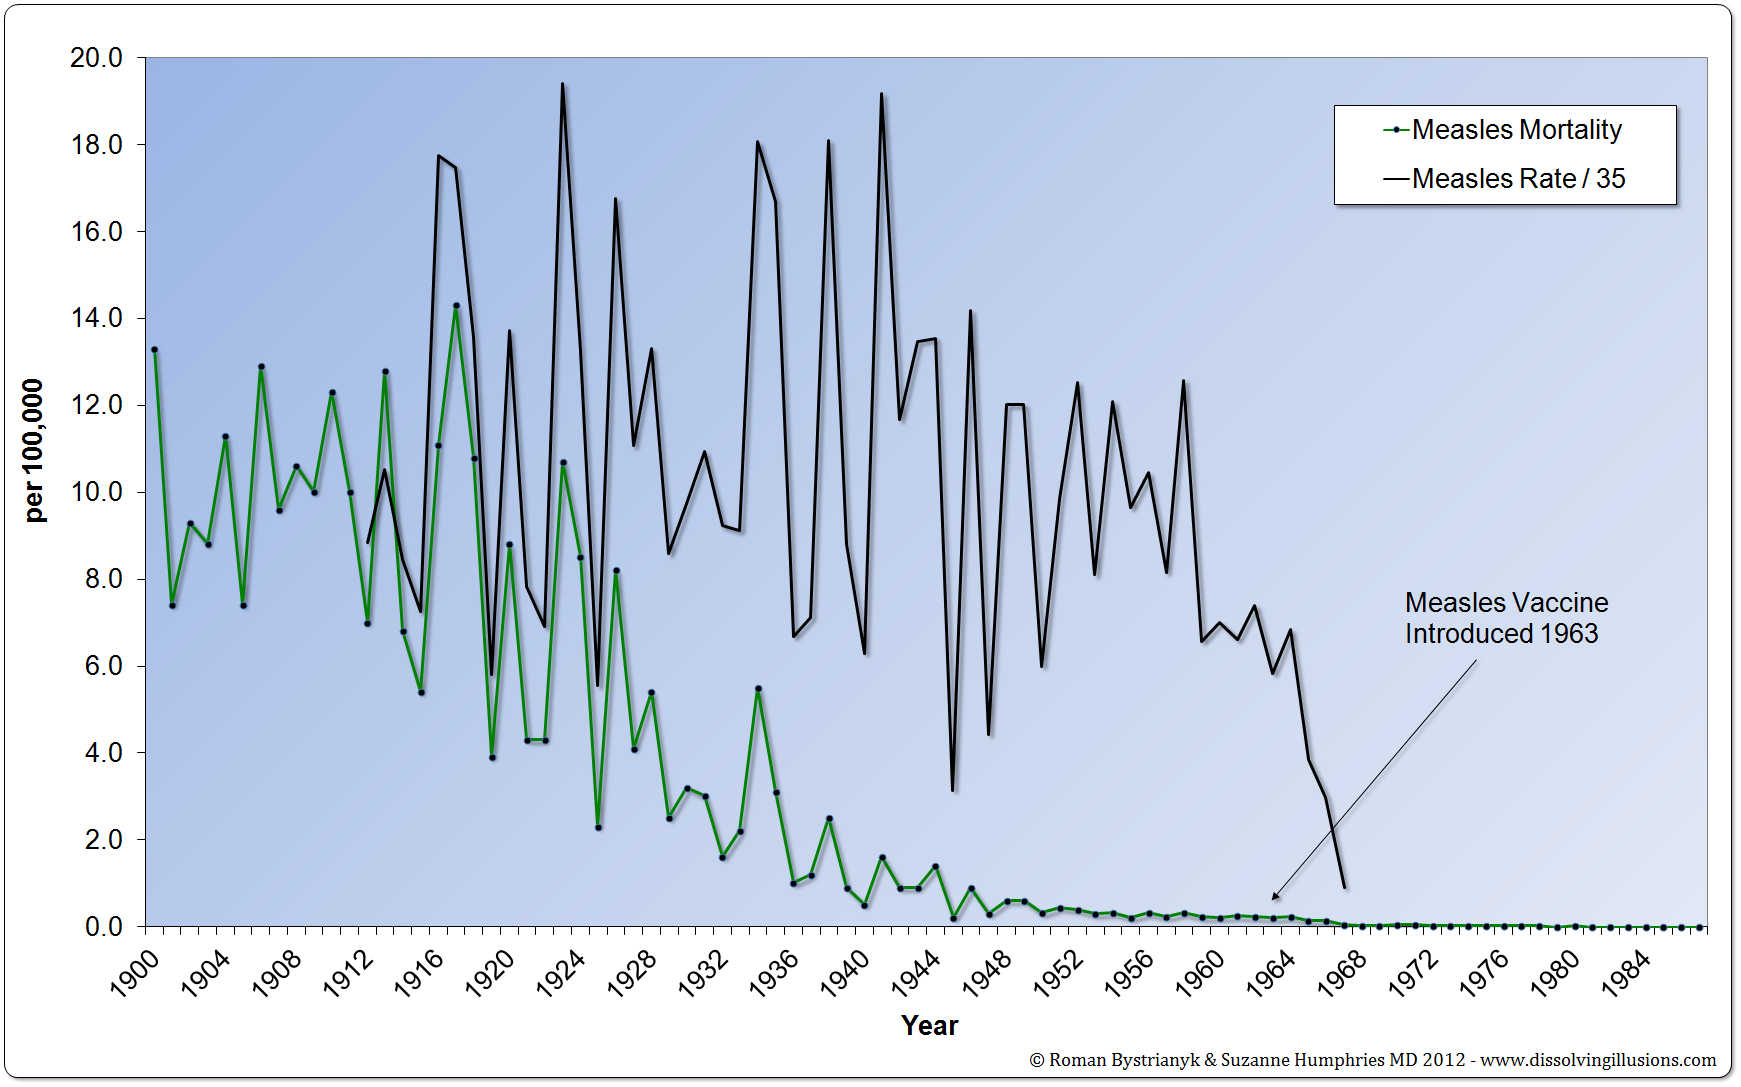
Throwback Bad Chart Thursday: The TRUTH about Bad Measles Charts the Mainstream Media Is Suppressing
This post was originally published February 5, 2015, but the measles situation has only worsened since then, with anti-vaccination propaganda leading to the worst outbreak since measles was all but eradicated in 2000, so this post is unfortunately timely once again. Roman Bystrianyk and Suzanne Humphries have a cherry to pick with proponents of vaccination. Their article on the measles…
Read More » -
Anti-Science

Bad Chart Thursday: The “Realistic” Scale of Climate Change Denial
To deny climate change in 2019, in the face of overwhelming evidence and the effects of climate change manifesting all around us, requires either a high level of ignorance and scientific illiteracy or sociopathic extremes of dishonesty. Today’s bad chart has both! It comes from Patrick Moore, policy adviser on climate and energy for the Heartland Institute, the organization known…
Read More » -
Politics

Bad Chart Thursday: Trump Argues for More Americans to Suffer and Die
Donald Trump has an impressively horrific record for avoidable death tolls. At last count, American fatalities in Puerto Rico post-Hurricane Maria have surpassed 3,000, many of them preventable had the Trump administration not done everything in its power to block and delay life-saving aid to the island. For context, the death toll for Hurricane Katrina was 1,833; Hurricane Sandy, 285;…
Read More » -
Politics
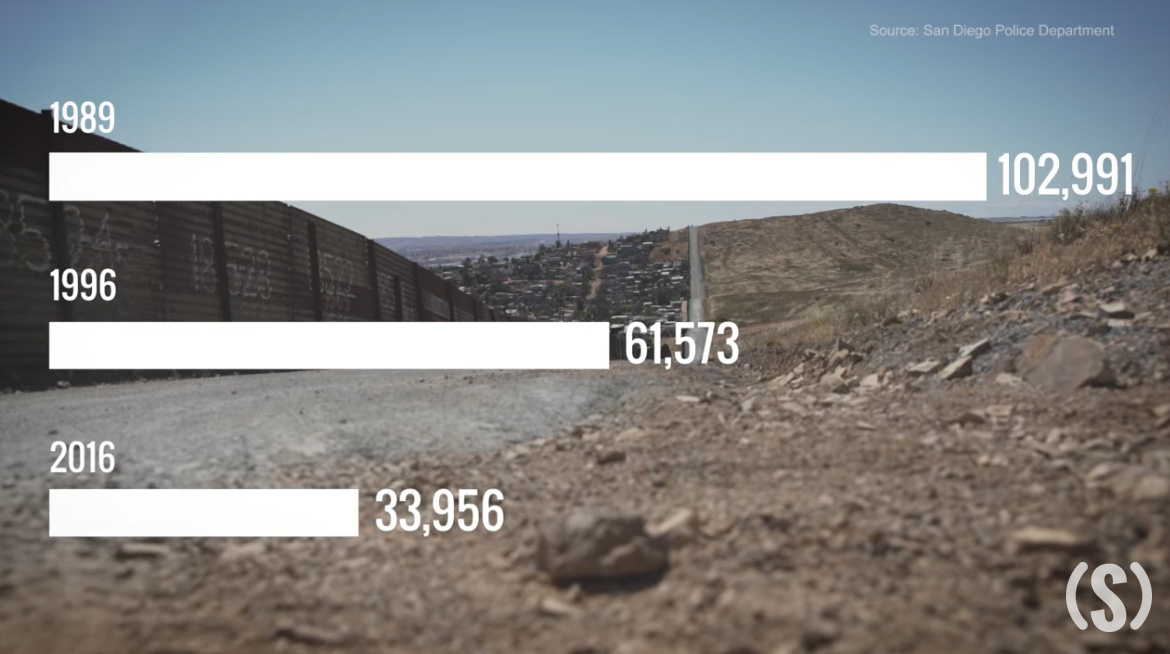
Bad Chart Thursday: Crime-Fighting Border Walls Cause Cancer
The justification for the border wall that Donald Trump wants to build at the US-Mexico border is that the wall would reduce crime. Though it’s well established that the immigrant crime rate is much lower than that of native-born Americans, and evidence suggests that immigrant-friendly cities tend to experience a lower crime rate than other urban areas, Trump and his…
Read More » -
Skepticism
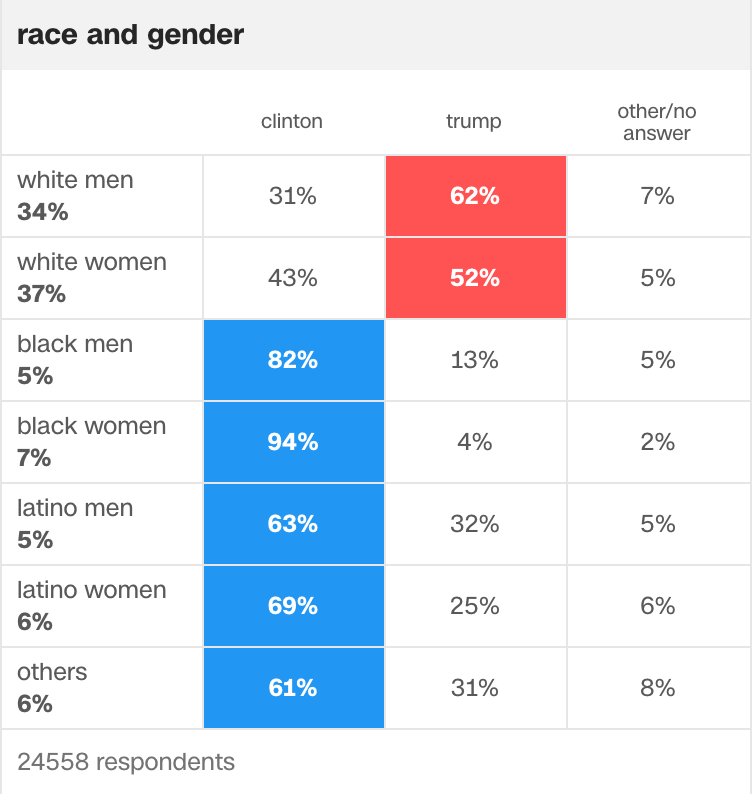
Bad Chart Thursday: The Unbearable Whiteness of Being a Trump Voter
Did you know that people of color are responsible for electing Trump? It’s true . . . if you lump people of color with white women. Just as falling out of chairs is a leading cause of death in the U.S. when grouped with cancer. Beanbags should clearly be mandatory. This blatantly misleading logic is the conclusion of yet another…
Read More »
