The Study Showing Over 260,000 COVID-19 Cases From the Sturgis Rally Has a Fatal Flaw
The researchers of the Sturgis biker rally study used a statistical method inappropriate for modeling infectious diseases.
When I first saw headlines last week that researchers found that the Sturgis motorcycle rally, which attracted 460,000 attendees to Sturgis South Dakota last month, has resulted in over 260,000 new COVID-19 cases, my first reaction was one of indignation. How dare these bikers take indiscriminate risks like attending a Smash Mouth concert in middle of a pandemic, bringing disease back with them to their hometowns. I mean, can you even imagine risking your life to watch Smash Mouth? And it turns out that they weren’t just risking their own life, but those of all Americans by causing a superspreader event across the nation, resulting in over 260,000 new cases of COVID-19. 260,000! That’s so many! That’s …too many. Unbelievably too many.
My personal feelings of indignation melted into skepticism the more I considered that 260,000 number, representing almost one in five new cases of COVID-19 diagnosed in the US after the Sturgis rally. I was willing to believe there may have been an increase in cases due to the rally, but 260,000 just didn’t seem plausible.
Just based on some of the details about the study in articles regarding it, I formed some ideas around what may have gone wrong in the study. The study compared counties with large numbers of people who had attended the Sturgis rally to control counties that didn’t attend. This would be based on the assumption that the only differences in the Sturgis attendee and control counties are the presence of Sturgis attendees. But, perhaps there are other differences as well. Maybe places where a lot of people chose to travel to Sturgis for the rally tend to have a culture that eschews mask-wearing and social distancing more than counties without Sturgis attendees? That could mean that the results the researchers found were actually measuring cultural or legal differences in the locations rather than the presence of bikers who went to the Sturgis rally. Eventually my curiosity got the better of me and I figured it was time to sit down and read all 60 pages of the study to see if my instincts regarding the problems it had were right. In the end, what I found was much worse than just some misguided assumptions.
The actual issue I found with the study was a very basic statistical problem that the researchers didn’t account for. To compare rally counties (i.e. the counties with large numbers of people who attended the Sturgis rally) to control counties (counties where people did not attend the Sturgis rally), the researchers looked at the COVID-19 rates prior to the rally and after the rally, noting that if the counties looked the same in the pre-period but different in the post-period, then the differences in the post-period must be due to the rally attendees.
However, as is typically the case in an environmental study like this one where a real control group isn’t possible, the rally counties and control counties didn’t have the same number of COVID-19 rates even prior to the rally. Luckily, there are many statistical methods that can be used to normalize the groups in order to make them look similar enough to compare.
The method the researchers of this study used to normalize the pre-period is a statistical method called differences-in-differences (commonly shortened to diff-in-diff). This method corrects for a mismatched pre-period by simply subtracting the differences between the groups then holds this subtraction from the pre-period through to the post-period. In other words, if the treatment group has 15 infections in the pre-period and 30 infections in the post period and the control has 10 in the pre-period and 20 in the post-period, diff-in-diff would see that there is a difference of 5 in the pre-period (15-10=5) and then subtract that 5 from the treatment group in the post-period as well (30-5=25). It will then compare the adjusted number of infections in the treatment group (25) to the actual number in the control (20) and say that the real post-period difference was 5 infections.
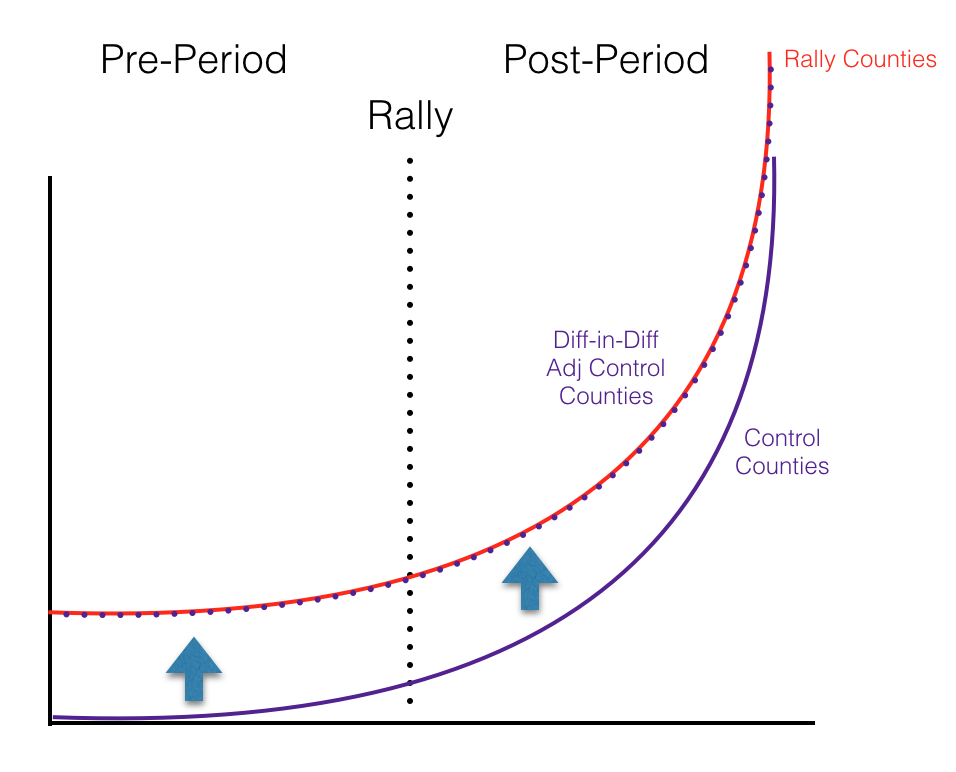
If you’re a visual person, this is how diff-in-diff would look on a chart. The red solid line is the treatment group. The purple solid line is the control. As you can see, in the pre-period before the event, the treatment group was already different than the control. The purple-dotted line is the control group adjusted upward using diff-in-diff. Once it’s adjusted, you can see that in the pre-period, the adjusted control is now equal with the treatment group. Then, after the event, the treatment group’s trajectory moves upward while the purple control remains the same. The differences between the treatment group and the adjusted control in the post-period (highlighted in yellow on the chart) are the differences you could say were caused by the event.

Diff-in-diff is a commonly used method for adjusting for pre-period differences because it’s very easy to understand and apply. You don’t need to be a statistician to do some simple subtraction. However, diff-in-diff has a major flaw in that it is based on the assumption that the rate of change (or derivative) in the treatment and control groups are equal. It works great for something like the example in the chart above where both groups are on the same parallel, linear path. COVID-19 cases, aren’t linear though. In fact, if it often grows at widely different rates in different locations.
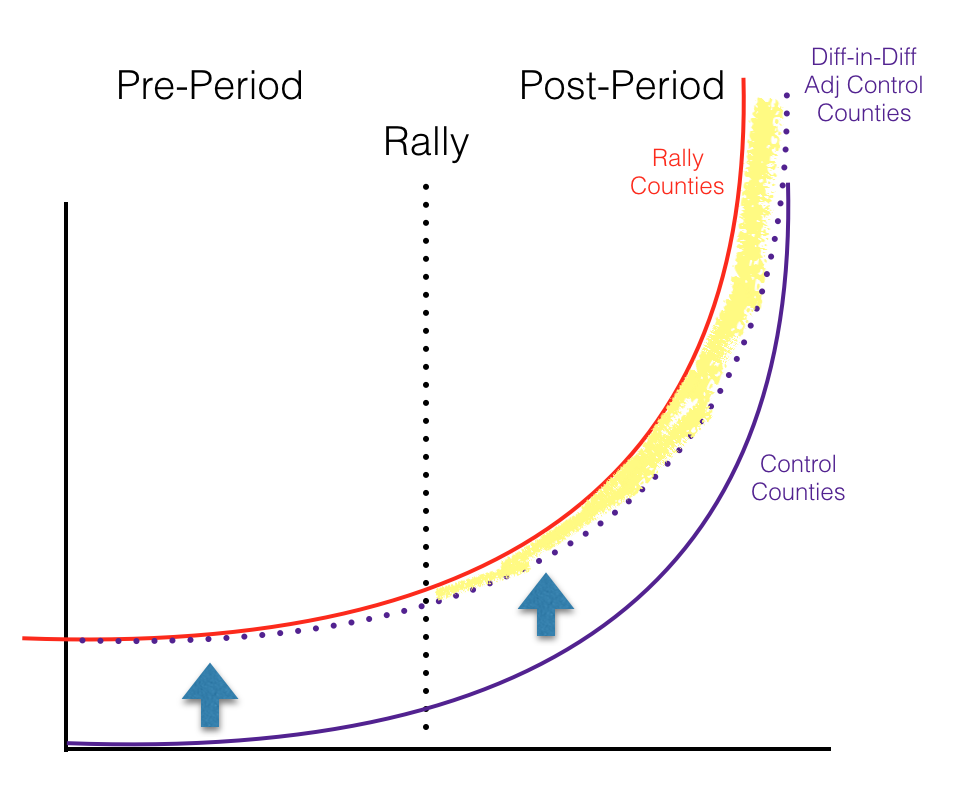
Often in locations that are early in their COVID-19 curve, COVID-19 cases will be growing at a rate similar to an exponential curve. If the rally counties and the control counties had COVID-19 rates growing at the exact same exponential rate and were at the exact same point in their curves (though the rally counties have more cases starting out) and the rally had no effect on COVID-19 rates, a diff-in-diff analysis would look something like this.
As you can see in this chart, the control county COVID-19 rates (red solid line) and rally county COVID-19 rates (purple solid line) have the same rate of change over time, but the rally counties have a higher number of cases. Diff-in-diff creates an adjusted control lines (purple dotted line) that is adjusted for the pre-period differences. Once adjusted, we can see that even in the post-period it follows the control county line exactly, showing no increase in COVID-19 cases caused by the rally. If there were COVID-19 cases cased by the rally, we would see the red line take a steeper course after the rally, leading it to diverge from the adjusted control line. The difference between those two lines could then be attributed to the rally.
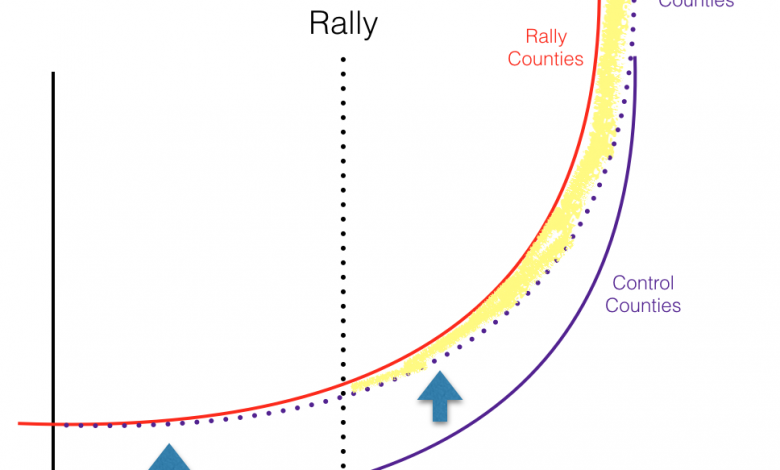
Based on everything we know about COVID-19 growth though, it’s highly unlikely that the rate of change would be exactly the same in the rally counties and control counties, especially if their starting points are different. So, let’s make one slight change to the above chart. In this example, growth rates in the rally counties and growth rates in the control counties do follow the exact same trendline (though rally counties have more cases starting out), but the rally counties are slightly further ahead on their trendline. If you tried to do a diff-in-diff, this is what your results would look like.
The only change in this chart and the prior chart is that the rally county trend line (red solid line) is shifted slightly to the left, indicating that they were just a bit ahead of the control counties on their trendline. Since early in an exponential growth curve, differences between curves that are at different spots on their trend line are very small, the adjusted control still moves up to the same spot it was in before. If you look closely you can see the rally line (red) and the adjusted control (dotted purple line) are starting to diverge prior to the rally, but by such a small amount it likely wouldn’t be statistically significant enough to be noticed by researchers.
After the rally, due to the nature of exponential growth, the differences between the rally county line and the control county line diverge by huge amounts (indicated by the highlighted yellow area). Remember, this is an example where there is no effect from the rally. The rally counties and control counties are growing at the exact same rate. However, if you did a diff-in-diff analysis, you would misattribute the yellow-highlighted area to COVID-19 cases caused by the rally even if there weren’t actually any differences at all.
This is why you can’t do a diff-in-diff analysis on data with differing growth rates. Even growth rates that have such slight differences that you don’t even notice them in the pre-period can cause huge differences in the post-period that would then be misattributed to the result of the event you were trying to measure. We absolutely know that COVID-19 growth rates vary widely from place to place and change dramatically over time even in the same location. Also, disease growth just doesn’t follow the simple exponential growth lines I posted above. If one county has far more cases than a second county, growth rates are by definition almost certainly going at a different rate, so attempting to do a diff-in-diff analysis would be a fool’s errand and potentially result in showing very large effects even if none existed.
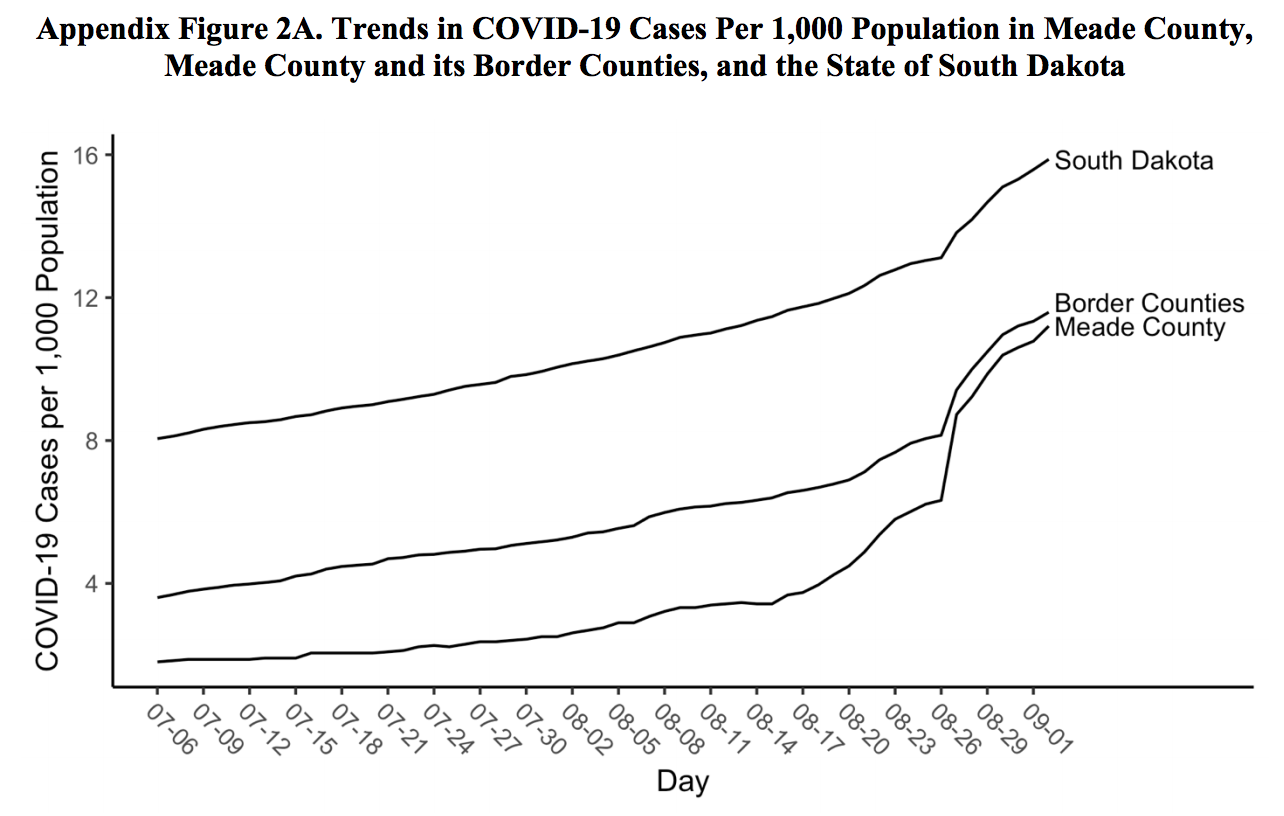
Did the motorcycle rally in Sturgis really lead to 260,000 new COVID-19 cases? Probably not. Did the rally result in any increase in cases? Probably. Just eyeballing this chart I found buried in the appendix of the Sturgis paper, which shows raw numbers of cases in Meade County where the rally took place, does appear to show that COVID-19 cases skyrocketed at a rate that seems incongruous with it’s prior trend line in the weeks after the rally. In fact, you could get an estimate of the number of local cases caused by the rally in Meade County by just drawing a line on the chart that continues the trendline from prior to the rally to after the rally then assume the difference between your drawn line and the actual line are the cases caused by the rally. Would that be a very good estimate? Not really. Would it be a more accurate estimate than the one put forth in the Sturgis study? probably.
Even if there was a noticeable rise in COVID-19 cases in the county where the rally took place, the 260,000 number is almost certainly false. The researchers probably should have spoken with an epidemiologist prior to publishing. This may have helped them realize that 260,000 is far outside the realm of plausibility, indicating that there is a problem in their methodology. They also should have been much more careful about using a method like diff-in-diff without first confirming the stability of rates of change of COVID-19 case trend lines. Diff-in-diff is just not the appropriate method to use to measure something as unpredictable as an infectious disease.
There are a lot of other problems with this study other than the issues with using diff-and-diff. If you want to read more, I strongly recommend this piece at Slate which covers a lot of the other places the researchers of this study went wrong.