Throwback Bad Chart Thursday: The Pareidolia Plot
Originally published on January 23, 2014.
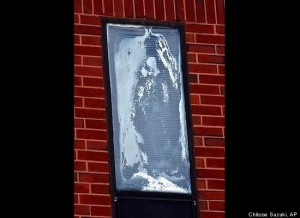
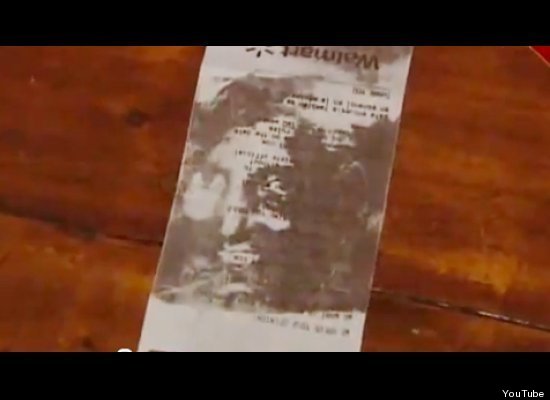
As skeptics, we’re probably all familiar with the concept of pareidolia, perceiving a distinct pattern, often an image, in randomness, such as the many sightings of Jesus and the Virgin Mary in food items (grilled cheese, tortillas, pizza, Cheetos), stains on walls, wood grain, gnarled trees, and even in a dirty sock. The same process is at work with sound, such as hearing distinct words in music played backwards.
Our brains seek patterns, and we often see meaning in these patterns, even though they are randomly made. This meaning is inevitably culturally specific. One person’s Virgin Mary, for example, is another’s Darth Vader eating a giant sno-cone:
Perceiving these patterns is a trait humans share across the globe, although the meanings tend to bring out the narcissism in us. In keeping with this combination of factors, I decided to graph instances of pareidolia around the world as a function of distance from my house.
I had no idea that doing this would lead to the greatest discovery of my life.
Just bear with me here. Here’s the initial scatter plot.
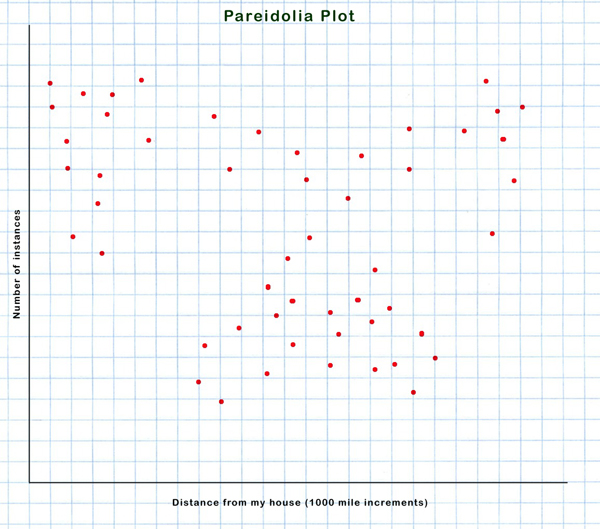
Seems pretty random, right? But look a little closer. Do you see him? The sideburns? The mustache? Let me help you out.
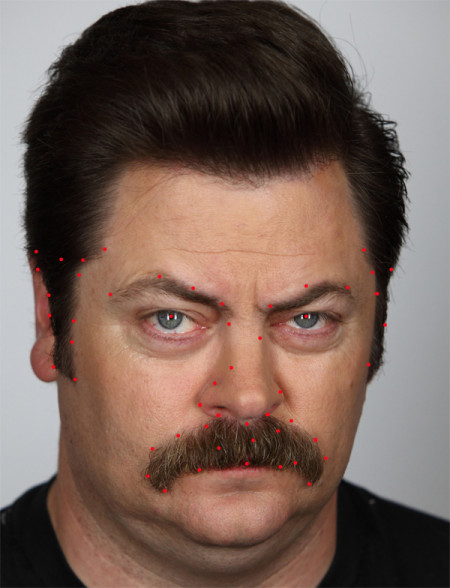
That’s right. When you graph pareidolia related to where I live, you get Ron Freaking Swanson. (Might also correlate with Burt Reynolds. Further testing is needed.)

