Bad Chart Thursday: Crime-Fighting Border Walls Cause Cancer
The justification for the border wall that Donald Trump wants to build at the US-Mexico border is that the wall would reduce crime. Though it’s well established that the immigrant crime rate is much lower than that of native-born Americans, and evidence suggests that immigrant-friendly cities tend to experience a lower crime rate than other urban areas, Trump and his supporters continue to cite reducing immigrant crime as the purpose of the wall.
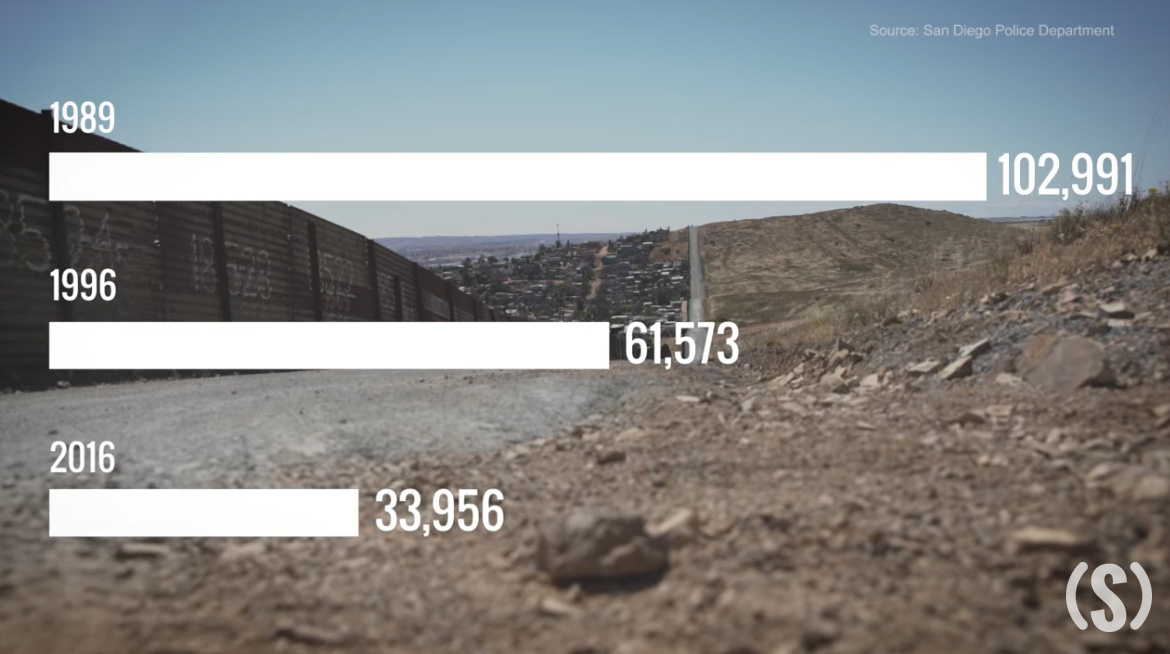
For example, earlier this month, the Daily Signal created a video purportedly demonstrating that the border wall in San Diego has reduced crime since it was built in 1992.
To make this point, reporter Kelsey Harkness includes a chart showing the total number of crimes in San Diego in 1989, 1996, and 2016. (Crimes included are murder, rape, aggravated assault, robbery, burglary, larceny, vehicle theft, and property crime.)
The chart labels and title are apparently invisible, like all these criminal immigrants we hear are flooding across the border despite evidence to the contrary. Within the context of the video, though, the message is clear: After the wall is built, crime decreases; therefore, the wall reduced crime.
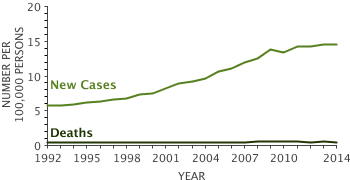
Following this logic leads us to another shocking conclusion: Since the wall was built, in 1992, cases of thyroid cancer have increased, according to the National Cancer Institute; therefore, the wall causes thyroid cancer. Makes perfect sense, right?
Similarly, the border wall in San Diego is no doubt responsible for everything from increased prices and the decline of manufacturing jobs to higher rates of autism diagnoses.
As Kevin Drum at Mother Jones has pointed out, crime has been going down throughout the US for decades, including in San Diego. That trend continued after 1992 without an increase in the rate of crime reduction in San Diego to suggest a local reason for the crime reduction beyond the national trend. And, of course, Harkness does not explain why crime started decreasing in 1989, three years before the wall was built. Perhaps an invisible prototype was built before the visible wall.
All of this, including the original chart and its rationale, is obviously ridiculous. Yet with the $21.6 billion-plus for the wall being proposed alongside enormous cuts to our social safety net, including health care, risking cancer by building a more extensive border wall is not actually that far fetched.
H/t Jamie Bernstein for sharing this chart and Drum’s article with me.