Bad Chart Thursday: The TRUTH about Bad Measles Charts the Mainstream Media Is Suppressing
Roman Bystrianyk and Suzanne Humphries have a cherry to pick with proponents of vaccination. Their article on the measles vaccine was recently published on Health Impact News’s Vaccine Impact website under a heading promising us a mouthful of impacted truth: The Truth About Measles the Mainstream Media is Suppressing.
The actual article by Bystrianyk and Humphries is titled “Was the Introduction of the Measles Vaccine Responsible for Wiping Out Measles?” although the article barely even touches on that question, which is related to incidence of measles. Instead, the authors begin with a focus on mortality rates, which makes sense if you believe vaccines fight death, not disease.
Maybe Big Pharma and the mainstream media are in cahoots to suppress the TRUTH about a vaccine against death! I bet Big Funeral is in on it as well. It explains so much.
What it doesn’t explain is why the authors of this article felt compelled to go on at length about how mortality rates from measles were decreasing before the introduction of the measles vaccine as though this has anything to do with the effectiveness of the vaccine against measles. Of course people were less likely to die from multiple diseases with improvements in public health, hygiene, nutrition, and other factors.
But let’s not allow a firm grasp of the obvious get in the way of enjoying the first in a series of painfully bad charts:
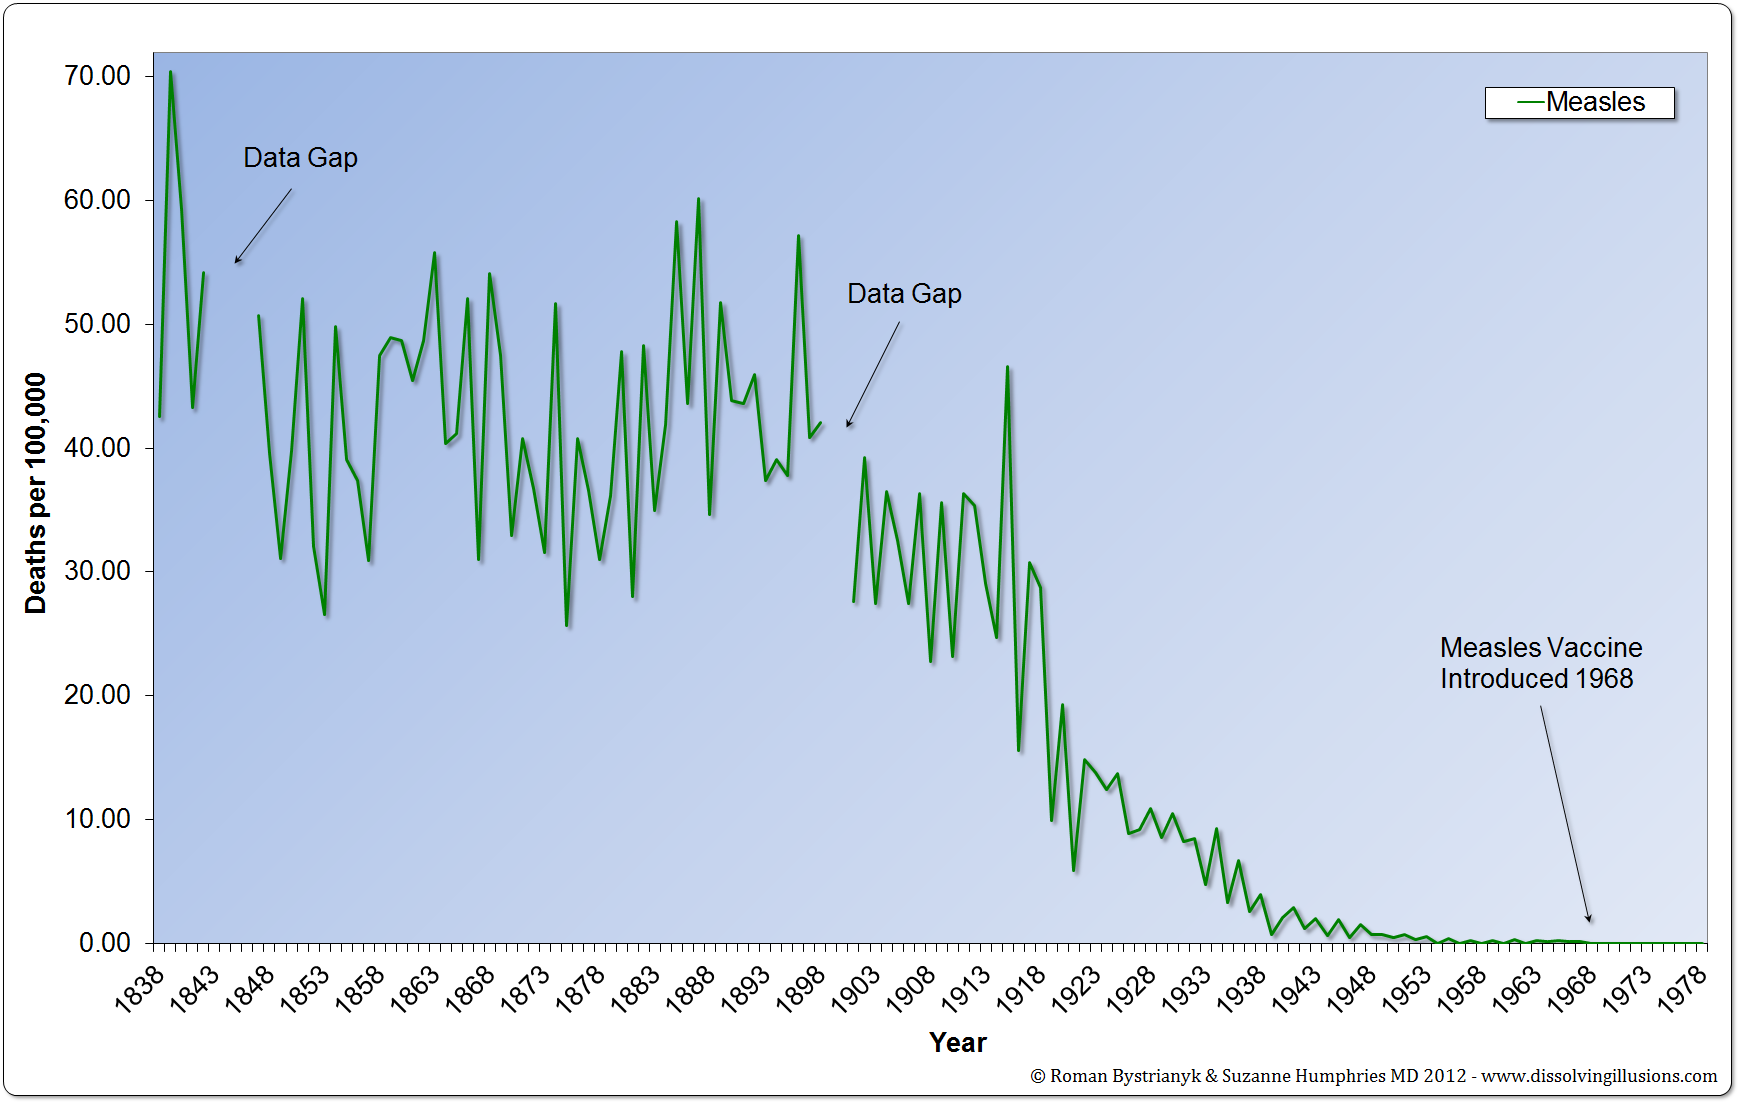
There’s only one reason to start this graph in 1838: to increase the scale so that the death rate appears even smaller in the years before the vaccine was introduced than it would if the graph focused on a relevant time frame. It’s not like anyone looking at this doesn’t already know that mortality from all causes was much higher in the 19th century than in the 20th. Noting the data gaps is a nice touch that almost makes it seem as though the authors are paying careful attention to detail and honesty, but that impression is quickly dashed by the incorrect year for the vaccine introduction, which was 1963, not 1968.
When I first saw that year in the chart, I thought I might have misunderstood this article as focusing on the United States. Perhaps the data came from another country’s mortality rates. I tried checking the references, but the source for this graph was unclear. The note numbers in the article start with 5, not 1. I think we’re supposed to assume that reference 4 applies to this chart, citing historical US census statistics, but when I tracked down the chart on the website given in the graph note, I discovered that this chart and the subsequent chart are based on UK statistics. But then the later charts in the article are based on US statistics. And at no point do the authors explain this or even note it. Regardless, 1968 is the incorrect year for the UK as well. As in the US, the vaccine was first introduced in 1963.
The next chart shows mortality rates for scarlet fever, again from the UK and again starting with 1838. The purpose is to show the declining mortality rate of a disease that is not vaccinated against to make the point that mortality rates have been decreasing over time. I won’t bother reproducing it here because it’s similar to the above and already a waste of space in the original article.
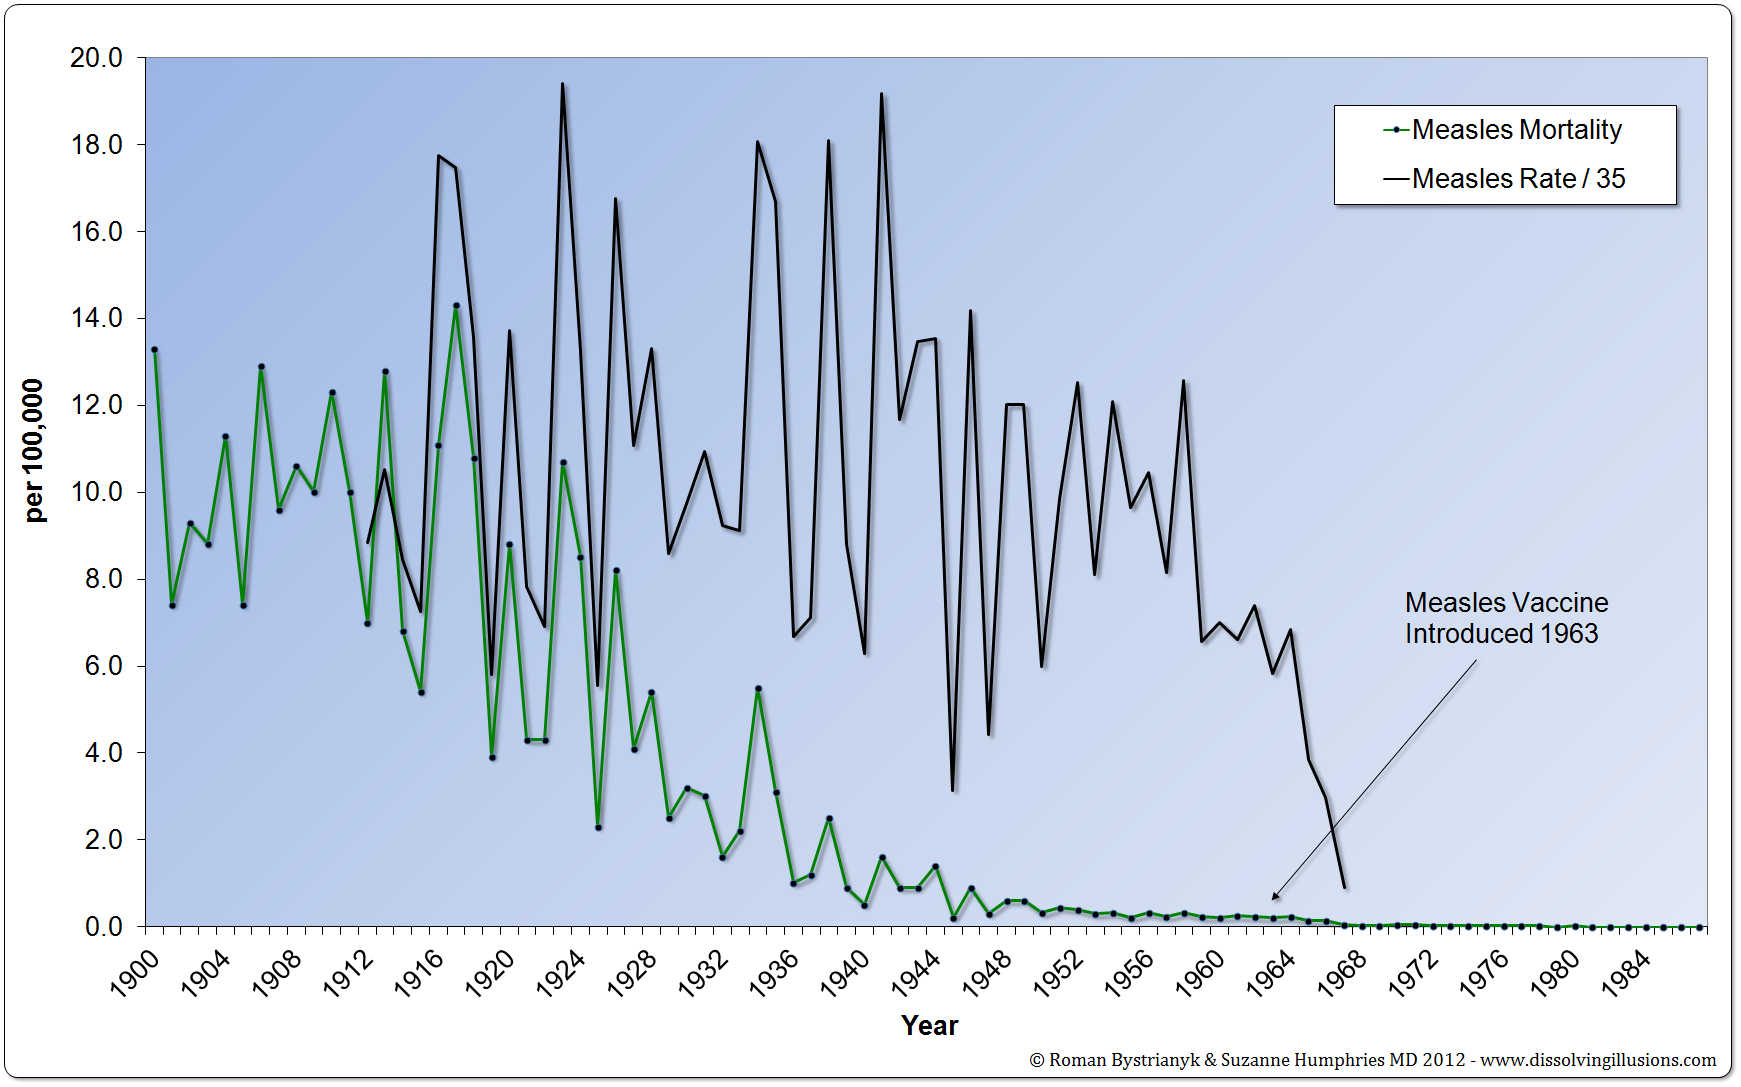
Finally, we get to the chart and discussion that has any bearing whatsoever on effectiveness of the measles vaccine: a chart showing incidence along with mortality rate, this time in the US.
Instead of showing the actual incidence, they show it divided by 35 per 100,000, making the incidence seem much lower than it actually was. But hey, they got the year right this time for the vaccine introduction.
Even with this blatant manipulation, the drop in incidence after vaccine introduction is so clear that the authors have to admit, “Measles incidence did apparently dramatically drop after 1963.” So after slogging through irrelevant discussion of mortality rates and other diseases, such as pertussis, as though they are interchangeable with measles, we get to a relevant point and the authors’ own jury-rigged chart still shows the clear benefit of measles vaccination.
OR DOES IT?
The authors then ask, “But can this drop be completely attributed to the success of the measles vaccine?” And I’m thinking they are going to present other possible explanations for the drop, but no. They describe some reported problems with the early vaccines and the subsequent improvement in both vaccine and vaccination schedule to make the immunization safer and more effective. The horror. Scientific learning, correction, and progress are THE WORST. But none of this provides any alternative explanation for the drop in measles rates after the vaccine introduction.
At long last, after much hand waving and many detours along Non Sequitur Boulevard, the authors answer the question they ask in the title: Was the introduction of the measles vaccine responsible for wiping out measles?
Are you ready for it? I mean, after coming this far, this has to be good, right? Can you hear the orchestra’s crescendo, the drum roll, the FINAL COUNTDOWN?
Here it is. The BIG EXPLANATION.
Measles went away on its own.
Yep. That’s it. It was already declining. *shrug*
No explanation for the extreme drop right after vaccination started. No evidence that vaccines weren’t the cause of the drop to suggest considering alternative explanations. It’s like they’re not even TRYING.
All they provide is this last sad little chart with a trend line and the claim that if the “trend line held, measles incidence would have hit zero by around the year 2000.”
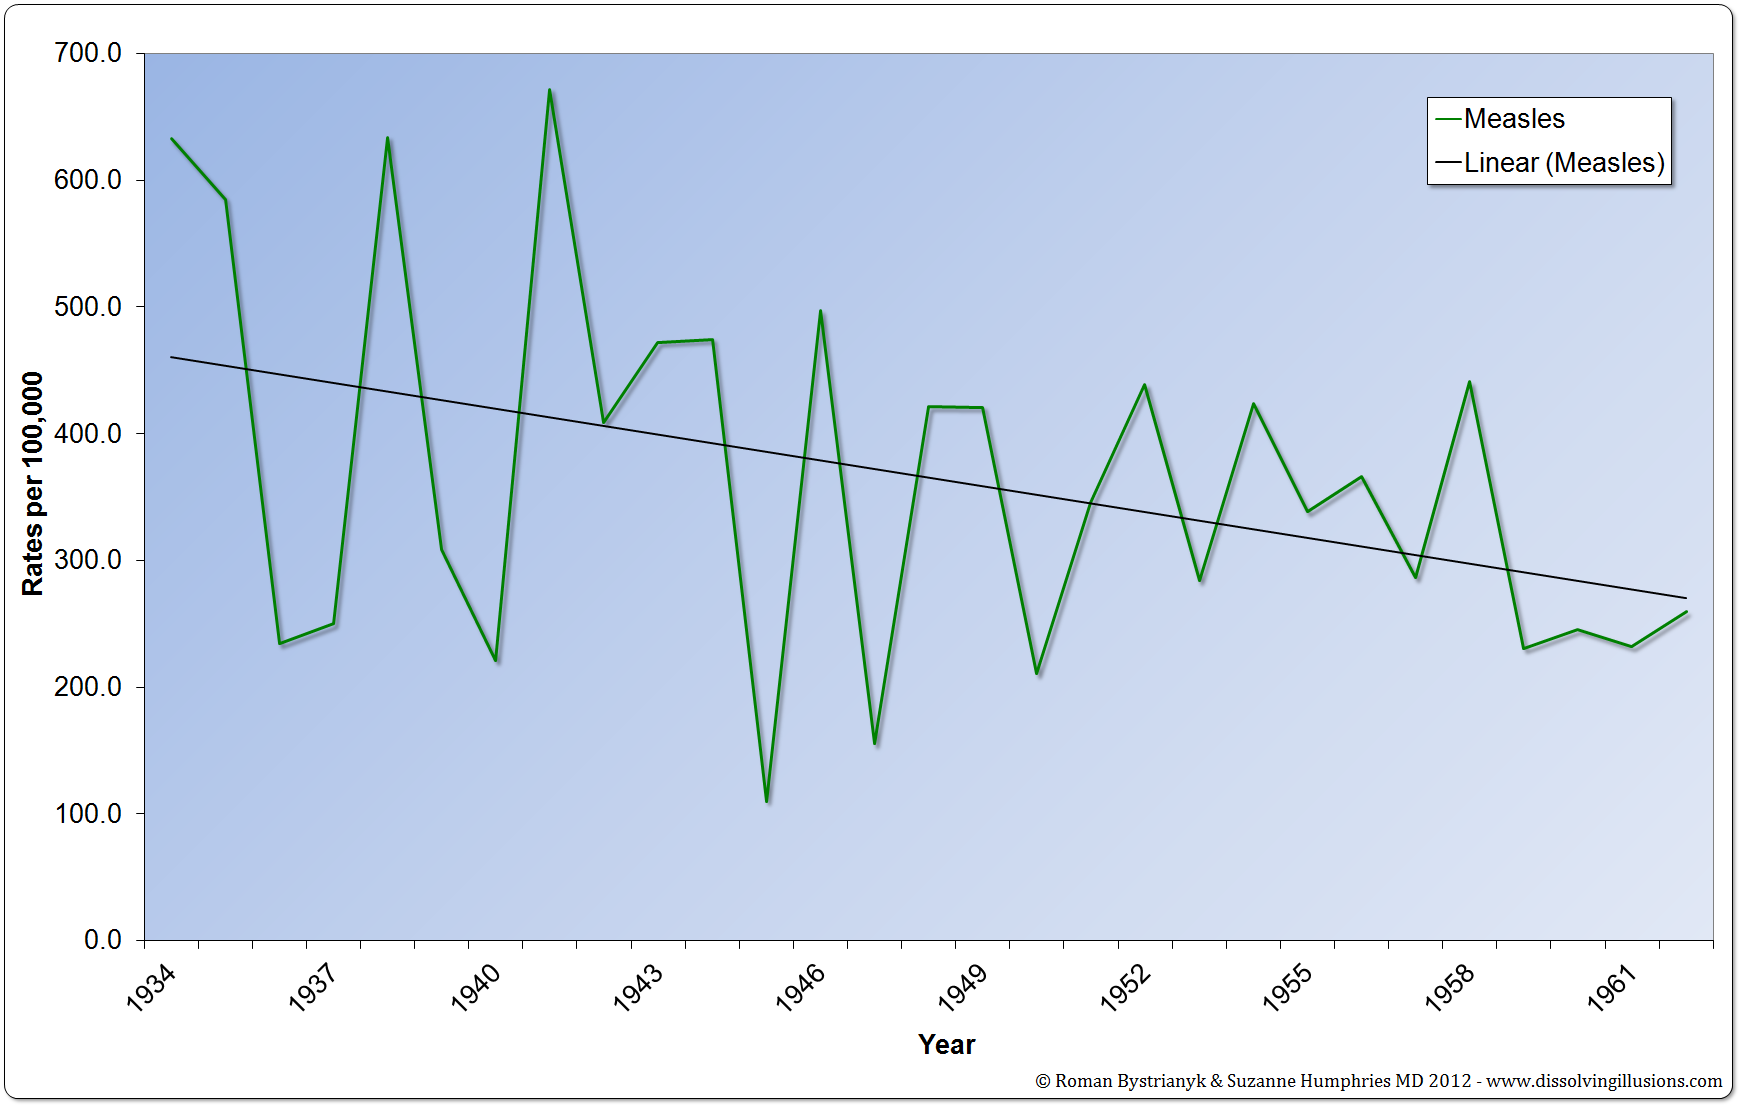
For some reason, they start the graph at 1934, instead of 1912, the starting year they use in the chart above. I wonder how many tries it took them to find a year that would make their trend line angle where they wanted it?
Using the same data but starting at 1912, here’s where measles ends up in 2000 without vaccination:
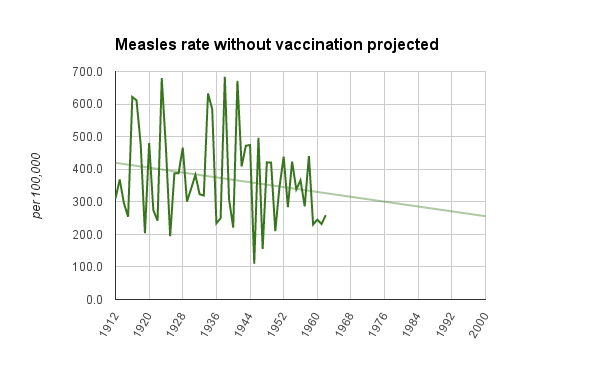
Neither trend-line chart is adjusted for population growth or anything along those lines, but the point is clear. The only actual argument against the effectiveness of measles vaccines that the authors make is supported by deliberately manipulating the trend line.
But yeah, the mainstream media is suppressing this “truth.” Makes perfect sense.
H/t to Abby D. for the link to this article and its bounty of bad charts.


Our Skeptics in the Pub reboot on Monday watched Invisible Threat, a DVD about vaccines made by some amazing high school students. They included the first chart (or one very similar) and explained exactly what was wrong with it (conflating morbidity and mortality). Well worth watching if you get the chance. (You can download it for $5 from Vimeo; I would try to watch it with some friends or a class or other group so you can discuss it. There’s a lot of material to digest in 40 minutes.)
BTW, we had 12 people show up in the midst of a blizzard (12″ of snow, single digit temps), so this is definitely a topic a lot of people are interested in.
Mr. Spock has got his shots. Your kids should too. It’s the logical thing to do.
http://trekcomic.com/2015/02/04/mr-spock-wants-you-to-vaccinate-your-kids/
Just a point of fact checking. The is from CDC website:
“This recommendation is intended to protect those who may have received killed measles vaccine, which was available in 1963-1967 and was not effective.”
I think giving this information the date of 1968 is valid.
Here’s the full quote and link to CDC info:
“People who were vaccinated prior to 1968 with either inactivated (killed) measles vaccine or measles vaccine of unknown type should be revaccinated with at least one dose of live attenuated measles vaccine. This recommendation is intended to protect those who may have received killed measles vaccine, which was available in 1963-1967 and was not effective.”
In terms of a study, It makes sense that they started at 1968. Since the vaccine given between 63-67 was possibly different and as the CDC claims “not effective”. I don’t think it was nefarious of their part.
http://www.cdc.gov/vaccines/vpd-vac/measles/faqs-dis-vac-risks.htm
The recommendation was because live attenuated is more effect not because killed is wholly ineffective. The term used is not effective rather than ineffective for a reason.
It is still cherry picking.
An improved vaccine was introduced in 1968 (and further improved vaccines thereafter), but the measles vaccine was still introduced in 1963, a year they use later in the text and in a later chart.
Also, 1968 is in the UK chart, not the US chart, so NIH info might be more useful in discussing this than CDC.
I actually don’t think using 1968 was nefarious on their part. It was more likely just sloppy, especially given the use of 1963 later in the article. The trend line chart is definitely a better example of blatant dishonesty.
Hi Melanie, I’ve done some research after reading your post. 1963 was the year the measles vaccine was licensed. But it was only until 1967 that the measles vaccine mass vaccination program started. Prior to this only small scale experiments were done. Therefore I think that there is no problem with using 1968. In fact my common sense tells me that even if the vaccine is fully effective the effect should be able to be seen in a chart a few years later, not instantaneously (i.e. We should a drop only after 1970-1972).
Could you care to elaborate more why 1963 should be used?
Had that been the authors’ reasoning, they would have been simply exchanging one problem for another in their charts because (a) they do not explain that context for the first chart, and (b) they use 1963 in their second chart.
Either way, sloppy, bad charts. Because of (b), though, I doubt that this was their reasoning for using 1968 in the first chart. It’s a kind assumption, but not a likely one given the quality of their work throughout the charts and the article itself.
No matter how sloppy their charts are, I can clearly see that the measles mortality rate has fallen by 98-99% before the measles vaccine was licensed. Do you have any idea why the mainstream media had not informed their readers about this?
Because it is not true, you are reading the chart wrong.
I don’t know why* does anything, but this is asking the wrong question. Vaccines don’t generally affect the mortality rate of any disease; they affect the chances of catching the disease. The appropriate graph for examining the effectiveness of a vaccine is the incidence rate over time, not the mortality rate. (Mortality rates are affected by treatment, which clearly improved greatly beginning in the early 1920’s. I bet World War I and the 1918 flu epidemic had a lot to do with that, but that’s pure speculation.)
As Ben Franklin observed, “an ounce of prevention is worth a pound of cure”, though he was off by a factor of 2 for measles.
Asking (or answering) the wrong question is a common tactic of science deniers. For example, evolution doesn’t explain (and doesn’t try to explain) the origin of life, but creationists never understand this.
* Well “why” is because they think it will increase advertising revenue, but how they arrive at that decision is a mystery to me.
I don’t know why* [the main stream media] does anything…
For the same reason the mainstream media hasn’t reported the sky is blue?
Pointing out the obvious, that mortality from most diseases has significantly dropped since the early 19th century, isn’t exactly newsworthy. Morbidity, not mortality, tells us about the effectiveness of vaccines.
The measles mass vaccination program started in 1967 in US and 1968 in UK. The measles vaccine does not show to have any impact on the morbidity charts either.
No, the measles vaccination program in the US started in 1963. That’s the point you’re ignoring. An improved vaccine was introduced in 1968, created by Maurice Hilleman.
http://www.cdc.gov/measles/about/history.html
Measles incidence was cyclical, because after an epidemic, herd immunity would be high until the next birth cohort grew up to preschool/kindergarten age. Given the pattern of measles morbidity over the 20th century, it would have been a smart bet to predict that there was going to be a surge in measles cases in the mid-1960s. The introduction of the measles vaccine in 1963 put paid to that, however.
1954 — 710,000
1955 — 560,000
1956 — 630,000
1957 — 490,000
1958 — 780,000
1959 — 410,000
1960 — 450,000
1961 — 430,000
1962 — 500,000
vaccine licensed, even though it wasn’t optimal
1963 — 390,000
1964 — 470,000
1965 — 260,000
1966 — 200,000
1967 — 70,000
Improved vaccine licensed
1968 — 30,000
1969 — 35,000
1970 — ~60,000
1971 — 80,000
1972 — 40,000
1973 — 40,000
1974 — 30,000
http://www.historyofvaccines.org/content/graph-us-measles-cases
Could someone please enlighten me why the mainstream media keep on touting that the measles vaccine had saved countless of lives (to the hundred of thousands in some articles), and prevented measles in millions, when its effect is not at all noticeable in both the US and UK measles mortality and the morbidity charts?
Because the media is reporting the facts. Your inability to correctly read charts or understand statistics does not change those facts.
It is a fact that the measles vaccine did not improve the mortality rate (as was agreed by ALL of the posters above including Melanie).
It is also a fact that the US measles mass vaccination program started in 1967 (where only 55% were vaccinated); whereas in the UK its program started in 1968.
It is also a fact that there was no drop in the measles mortality/morbidity rate after the programs started (in fact there was a spike).
Mrmisconception could you please elaborate how you interpreted the statistics and charts? Thanks!
I would like to see a chart that was not manipulated (i.e. divided by 35) to flatten the results that shows what you say is a fact.
In the mean time look at the following sources to see charts that show a marked decline in morbidity.
http://www.vaccines.gov/basics/effectiveness/
http://archive.hhs.gov/nvpo/concepts/intro6.htm
http://en.wikipedia.org/wiki/Measles_vaccine
https://www.sciencebasedmedicine.org/vaccines-didnt-save-us-intellectual-dishonesty-at-its-most-naked/
The last link uses the same chart as vaccines.gov but accompanied by a thorough explanation by Dr. David Gorski about the same subject as this post, focusing more on the data rather than the charts.
Mrmisconception, speaking with the background as an engineer I can tell you that the 1/35 is not manipulation of data – it is just to fit both lines into the same scale. I am really surprised there are actually people who interpreted it as manipulation.
Also I have checked all the charts in your links. ALL of them conveniently uses the measles vaccine licensure date (1963) as the start date, when in actual 99.9% of the population had not been vaccinated yet. It was only in 1967 that the measles mass vaccination program started and the coverage reached 55%. NONE of the charts in your links show any effect whatsoever after the mass vaccination in 1967.
Do let me know how you agree with them that the vaccine licensure year of 1963 should be used.
It’s not a manipulation of the data, it’s a manipulation of the chart.
The same sort of manipulation that climate change deniers use to make the hockey stick seem to disappear, is disingenuous as hell but then I think you know that.
As for them using 1963 instead of 1967, even partial herd immunity would cause a decrease in instances. Beyond that it’s anomaly hunting but then I think you know that too.
And you can pretend that having, how did you put it, a background as an engineer gives you some sort of leg up in interpreting charts (that you proved is not so much) but I think you know it’s an attempted appeal to authority.
Vaccines work, pretending they don’t doesn’t prove they don’t, or as Phillip K. Dick put it “Reality is that which, when you stop believing in it, doesn’t go away.
mrmisconception,
Are you saying that the 0.01% measles vaccination coverage in 1963-1966 is enough to cause a decrease?
This doesn’t make sense. I have been hearing that we need 95% for herd immunity to work.
Just assuming that you are right – that 1963 (0.01% coverage) is the correct date to use – pieterb’s chart still show that the rate has dropped from 800 to 100 even before the introduction of measles vaccine. And you are going to disregard this information?
[citation needed] for your assertion that the vaccination rate prior to 1967 was 0.01%.
To elaborate further the measles vaccine coverage was 0.01% in beginning 1967 and 55% end of 1967.
Quote: ”
On 1st November 1966 US Government vaccine experts announced momentously to the world in a paper presented to the American Public Health Associations meeting in San Francisco, November 1,1966 that measles was to be eradicated in 1967 and just 55% vaccine coverage would do the trick. You can read it for yourself here in this formally published paper by those experts: EPIDEMIOLOGIC BASIS FOR ERADICATION OF MEASLES IN 1967.”
Google that piece of paper. You will find it. Now tell me why 1967 or later shouldn’t be used.
No, that is not a fact. Once again, the US measles vaccination program began in 1963. Morbidity began a precipitous drop in 1965, to about half the prior decade average, and to less than a tenth by 1968.
http://jid.oxfordjournals.org/content/189/Supplement_1/S17.long
You can see that when I was reading the year-by-year case rate from the History of Vaccines graph, I was erring on the high side. I put it as 30,000, this paper gives it as 22,231.
The mortality rate is one thing. Absolute mortality is another. In the decade or so prior to the introduction of the measles vaccine, there were about half a million cases a year, with 400-500 deaths, and around 50,000 hospitalizations. The incidence was about 300 per 100,000. The introduction of the vaccine dropped that to 1.3/100,000 in the early 1980s.
Do you now understand why the mortality rate is insignificant when the morbidity (incidence) has been decreased by a factor of ~200? In 1998 there were 69 cases and for the first time, 0 deaths.
[intended as a reply to harimaubalm above at 12:28]
Pieterb,
Could you please substantiate your assertion that vaccines did the job and not other things like the explosion in financial products, increasing US debt rate, Iraq War, my birth?
Note that this is a logarithmic chart. They do teach logarithms in engineering school, yes? Each of those bars is a change of one order of magnitude, i.e., a factor of ten. 15 years after the first elimination initiative started, the incidence of measles had decreased by a factor of 10. Bite me.
http://jid.oxfordjournals.org/content/189/Supplement_1/S1/F1.expansion.html
pieterb,
I understand your chart as clear as day. So the chart says:
Between 1950-1967, the measles rate dropped from 800/100000 to 30/100000.
After vaccination started in year 1967, the measles rate drop from 30/100000 to 0.1/100000.
So my conclusion of the chart is: Without the vaccine the measles rate had drop from 800 to 30. The vaccine allegedly reduced it further from 30 to 0.1.
You haven’t really understood the chart, have you?
“An average of 1.3 cases per 100,000 population was reported during 1982–1988, compared with an average of 313 cases per 100,000 during 1956–1960 (figure 1).”
http://jid.oxfordjournals.org/content/189/Supplement_1/S1.full
pieterb,
So your point is
– It was 313 cases in 1956-1960; and 1.3 in 1982-1988.
– So vaccine did the job.
Don’t you understand that a zillion things happened between 1961-1981? I’m really curious to know how you came to the conclusion that it was the vaccine out of that zillion pile.
Thing is, this pattern is shown time and time again as different vaccines have been introduced. Pretend all you want that it’s coincidence, just do me a favor and vaccinate yourself so that you don’t infect others unnecessarily.
mrmisconception,
I am not going to digress by dwelling into other vaccines (which I have plenty to say too). This thread is about the measles vaccine effect on mortality and morbidity based on the charts.
I am here for an intellectual discourse on that topic. I am also not pretending. If I am pretending I will definitely agree that the charts show that the measles vaccine improved morbidity. (Mortality is a non-issue – everyone here agrees that the measles vaccine did not improve mortality).
At least for the measles vaccine, if you can’t find any benefits shown from the charts, I urge you to correct the myth that “history proves that the measles vaccine improved mortality and morbidity rates” as is reported all the time. You will be doing a great service to your countrymen (I’m from Singapore BTW) because they do not deserve to be lied to again and again especially on something concerning health.
Open your mind.
So the question is then, do you believe that the measles vaccine is unique as to be separated from others, or is it just a way to keep from admitting that the pattern repeats?
I have not done enough research on other vaccines. So I will for the time being say that the measles vaccine is unique.
My questions to you:
– Is it ethical for the mainstream media to claim that history shows that the measles vaccine improved mortality?
– Is it ethical for the mainstream media to claim that history shows that the measles vaccine improved morbidity?
It is very much ethical for them to tell the truth, yes.
As much as I would like to agree with you, there is nothing that could back those two claims. I will appreciate it very much if you could send some evidence to me.
There’s an old adage that one should not open one’s mind so much that one’s brains fall out. The warning may be a bit late in your case, but let’s look at some hard data.
Measles is the most infectious disease in the world. 90% of non-vaccinated people exposed to the measles virus will catch it. Vaccinated people (and those who have survived a rubeola infection) exposed to the measles virus have about a 5% infection rate; breaking it down further, one dose of measles virus is 93% effective (7% infection rate), two doses are 97% effective (3% infection).
Now of all the “zillions” of other things that happened in that time frame, please tell us what other factor(s) would have had as significant an effect on the incidence of measles as vaccination. You must have some alternative hypotheses, let’s hear ’em. What else happened in those two decades that might conceivably have decreased the incidence of measles by a factor of more than 200? I was alive back then, and I can assure you that the vast majority of Americans had safe drinking water, access to nutritious foods, flush toilets and more than adequate bathing facilities, and had for decades.
pieterb,
It’s a far-fetched hypothesis that the measles vaccine done it just because there was no other possibilities out of the zillions, and that the Americans already had safe drinking water, access to nutritious foods, flush toilets for decades. Doesn’t fit the profile of a “science-based medicine” that I had been hearing all the time.
Did you understand or not the chart that you showed me, that measles morbidity rate has fallen from 800 to 30 before the introduction of vaccine, and that the vaccine had (allegedly) reduced it from 30 to 0.1 subsequently? What could have caused the reduction from 800 to 30 without vaccines?
If you have to choose a reason out of the zillions, I suggest that you choose the factor(s) that caused a drop from 800 to 30 rather than vaccines. Sounds reasonable to me that those factor(s) would keep on doing its/their jobs until the rate drops to near-zero. Not?
Based on your chart all factors other than vaccine reduced the incidence rate by 770. Whereas vaccine allegedly reduced it by 29.9.
I will be lying through my teeth to say that vaccine did the job.
Buzz Parsec, you mentioned that: ”
Vaccines don’t generally affect the mortality rate of any disease; they affect the chances of catching the disease. The appropriate graph for examining the effectiveness of a vaccine is the incidence rate over time, not the mortality rate.”
Melanie Mallon, you mentioned that: ”
Pointing out the obvious, that mortality from most diseases has significantly dropped since the early 19th century, isn’t exactly newsworthy. Morbidity, not mortality, tells us about the effectiveness of vaccines.”
The two of you are in agreement with me that the measles vaccine had not improved the mortality rate. (I am just focusing on the measles vaccine although you meant to apply your statements generally to all vaccines)
I trust that you will voice out (as you actively did here) against any claims that the measles vaccines had saved lives. You could find a couple hundred of such claims in a typical year.
For a start, http://www.unicef.org/pon96/hevaccin.htm says that the measles vaccine in 1996 prevented 1.6 million annual deaths. I trust that you will write in to correct their mistake.
Look, you can’t die of measles if you don’t catch measles. Of course vaccination reduces absolute mortality and saves lives. But only by prevention, not by reducing the severity of complications if you do get sick. Better treatment and nutrition is what caused the reduction in mortality prior to 1963, not by preventing measles, but by making it more survivable. Please don’t misrepresent my position.
The mortality rate can never be higher than the morbidity rate. Far fewer people get measles now than died of it before vaccinations. Those vaccinated, uninfected people directly cause a reduction in mortality rate.
As to your contention that the vaccine has not improved mortality rate, by your own figures, the pre-vaccine reduction (1950-1967), the measles rate dropped from 800/100000 to 30/100000. You should really be using the pre-1963 figures to avoid conflation during the period when the vaccine was introduced, but anyway.) This is a reduction by a factor of 26.7. Of course, a large part of that reduction occurred during 1967, in the midst of the massive vaccination program.
After vaccination started in year 1967, the measles rate dropped from 30/100000 to 0.1/100000. This is a factor of 300. So vaccination is
11 times as effective as whatever your imaginary preventative was.
Using a better date of 1966, the intermediate figure should be about 100, not 30, which changes the vaccine bottom line from 11 to 125 times as effective. And this is being as generous as possible to your position. If vaccination had made a significant dent by 1966 (3 years after introduction; I couldn’t find year-by-year figures for measles vaccination rates in the early 60s), then the vax bottom line improves to 500 times as effective.
Your essential argument is that “the measles vaccine had not improved the mortality rate” and therefore what? It’s ineffective? Didn’t decrease the morbidity rate? Shouldn’t be used? What? If you are against vaccination, say so. If you are incapable of understanding the difference between morbidity and mortality, and how one affects the other, do your homework. If you are just trolling or making a strawman argument, then go away. I don’t want to talk to you.
The point of Melanie’s article is that anti-vaxxers misrepresent the issues to score debating points by using deceptive graphs.
For example, the annual rates per 100,000 population have to be examined in light of the fact that, prior to measles vaccination, over 90% of the population over 15 had been infected by measles. Well over 90% of the infected people were consequently immune. So initially the vaccine was targeted at young children who had not yet been infected and to uninfected adults in contact with such children. It didn’t require that 90% of the population be vaccinated to make a huge difference in morbidity. That’s probably why the drop in morbidity started almost as soon as the vaccine was introduced, in 1963, rather than being delayed until virtually everyone was vaccinated in 1967.
See this article for more information.
You claim that the rate of measles vaccination went from .01% at the beginning of 1967 to 55% at the end of 1967. You cite a paper but don’t provide a link, so I looked it up. You obviously either didn’t read it or if you did, you didn’t understand it. This paper says nothing about the rates of vaccination at either time. The 55% cited in the paper is the authors calculation of the minimum immunization rate to cause the measles virus to be unsustainable in the general population and (eventually) be eradicated. The authors further argue that this rate is attainable by the end of 1967. Since the paper was published in March 1967, they obviously couldn’t know what the actual immunization rate would be at the end of that year. Where you got the .01% figure for beginning of 1967 from is a mystery, since you never post any links. My guess is it came from rectocranial inversion.
Also, you claim that pieterb doesn’t understand science-based medicine. Actually, you’re the one who is doing it wrong. A fundamental principle of science-based medicine, as distinguished from evidence-based medicine, is prior plausibility. This is what allows us to distinguish correlation from causation and allows researchers to design rigorous experiments and epidemiological studies rather than just rely on anomaly hunting. That a vaccine, which has been shown to prevent infection in the vast majority of people who receive it (97% for people with two doses) would drastically reduce the incidence of the disease is extremely plausible. If you wish to discount this possibility, the onus is on you to provide a more plausible explanation.
In my earlier comment, in the passage you quoted from me, I misused the term mortality rate. I should have used case fatality rate (or just fatality rate). I apologize for the resulting confusion.
Prophylactic vaccines (such as measles vaccine) don’t usually affect the fatality rate. The mortality rate (for short duration diseases like measles) is the morbidity rate times the fatality rate. Vaccines affect the mortality rate, but only by affecting the former term.
This points to another reason why basing a discussion or graph on mortality rate is deceptive. It is a compound variable, making it easy to conflate changes in morbidity with changes in fatality.
In my 3rd paragraph, I referred to “your contention that the vaccine has not improved mortality rate…” I should have used morbidity rate</em<, and was referring to your reply to pieterb where you say:
I stand my the rest of my comment.