bad chart thursday
-
Featured

Bad Chart Thursday: Reverse Twingineering
In “Time Magazine and the Impending Twin-pocalypse,” Deek takes apart one of the most amazingly bad Time articles in the history of crap, “The Problem With America’s Twin Epidemic,” by Sarah Elizabeth Richards. While reading Deek’s sweet, sweet smackdown, my chart-dar went off, for she presented a perfect example of the quintessential bad chart, followed by a chart that shows…
Read More » -
Meta Stuff
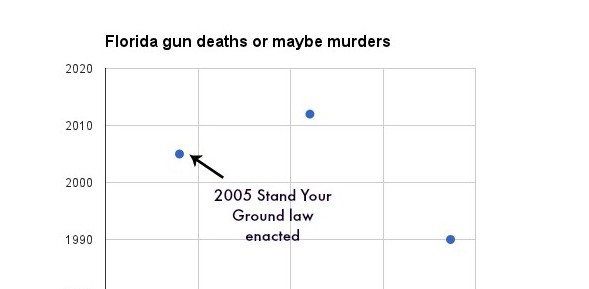
Bad Chart Thursday: Stand Your Ground
By now, I’m sure you’ve all seen the Worst Chart in the Universe, created by Christine Chan of Reuters, depicting the number of gun deaths (or murders?) committed using firearms in Florida, with emphasis on the 2005 enactment of the state’s Stand Your Ground law. Here it is for those who haven’t seen it being snickered across Twitter or in…
Read More » -
Anti-Science
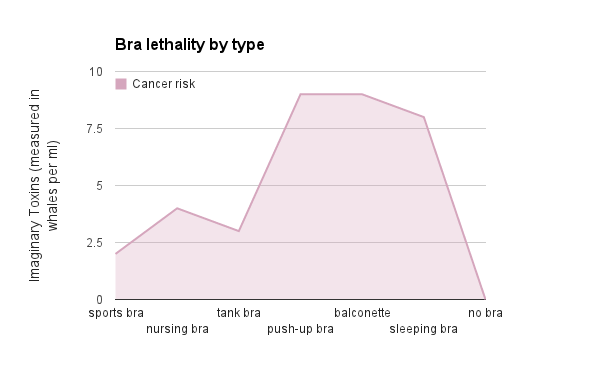
Bad Chart Thursday: Bra Cancer
Hey, ladies. Maybe you’ve heard that “scientists” want you to stop wearing a bra. And by “scientists,” I mean this guy. Apparently, wearing a bra gives you breast cancer, according to breaking news from an intrepid reporter. And by breaking news, I mean studies that don’t actually show this, some that are 20 years old, and by intrepid reporter, I…
Read More » -
Random Asides
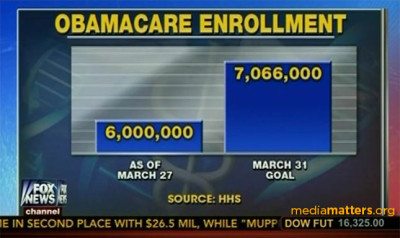
Bad Chart Thursday: Healthcare Spin
You know what would make this feature easy to write? Just basically reprinting every chart Fox News creates on any topic ever. Our own DrRubidium recently shared the latest, originally reported on Media Matters: the VAST GULF between predicted enrollees in Obamacare and actual enrollees as of March 27. Holy hell, would you look at the huge difference in size…
Read More » -
Featured
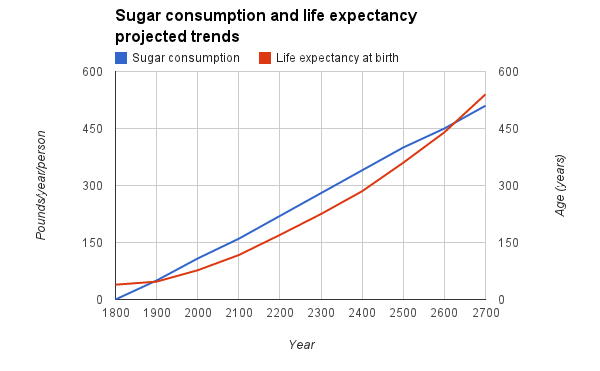
Bad Chart Thursday: Sugar Could Make Us Immortal
I was casually strolling about the Internet the other day, enjoying a hot fudge doughnut M&M sundae, as I am wont to do, when I came across some SHOCKING news about US sugar consumption: By 2606, the US Diet will be 100 Percent Sugar. My first thought was that this would be only a 5 percent increase in my current…
Read More » -
Random Asides
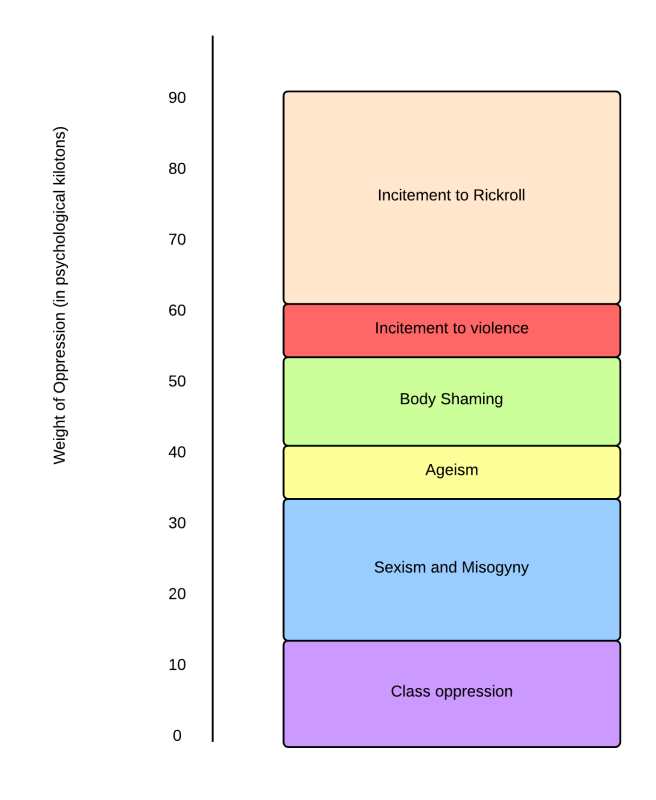
Bad Chart Thursday: Cake as a Tool for Oppression
It’s my birthday, so I am being reminded from all directions of that insidious edible sponge with frosting also known as cake. All these positive mentions of cake only demonstrate how successful the Cake Lobby has been with its spin. How else could we continue to propagate the myth that cake is good despite all the evidence* demonstrating that cake…
Read More » -
Random Asides
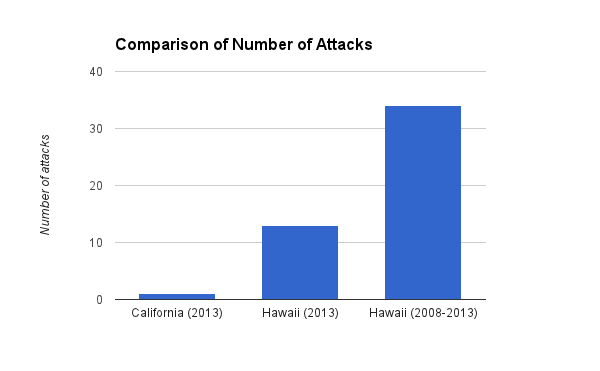
Bad Chart Thursday: Shark Attack Risk Increases 1200% in Hawaii!
According to International Shark Attack File stats, between 2008 and 2013, shark attacks increased from 1 a year to 13 in Hawaii. I know, I know, that’s still a very small number, but that is a 1200% increase, which is MASSIVE! In contrast, California, which had TWICE the number of attacks as Hawaii at the start of this period, has…
Read More » -
Featured
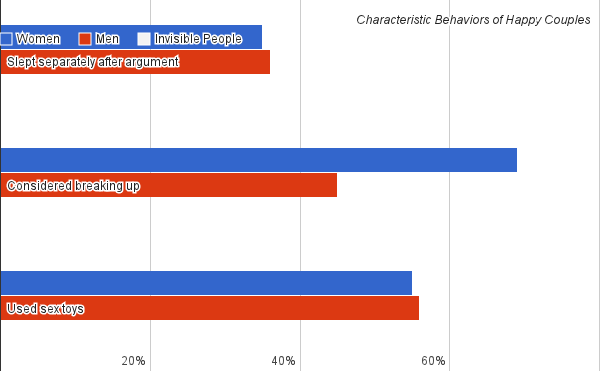
Bad Chart Thursday: Valentine Edition
It’s that time of year again, when writers across the Internet tell the romantic tale of two unlikely lovers coming together at last: Correlation and Causation. Over on The Normal Bar blog, these star-crossed lovers teach us all a few lessons about love. And by love, I mean sex. Because it turns out, they are pretty much the same thing.…
Read More »
