bad chart thursday
-
Anti-Science
Bad Chart Thursday: Straight Men Can’t Get HIV Because “Science”
Sometimes, a perfectly good chart can be used to make flawed, even downright harmful arguments. It’s not the chart’s fault. It’s just hanging out, unassumingly presenting some data about, say, oranges, when someone decides to use it to make a point about apples. Sometimes this person just misunderstands the chart or doesn’t read the context or even the title of…
Read More » -
Feminism
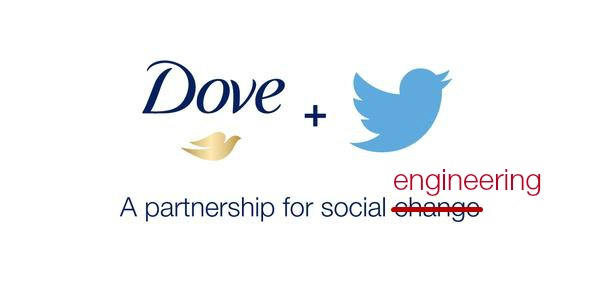
Bad Chart Thursday: Dove’s #NewspeakBeautiful
I always knew that George Orwell was on to something. Sure, he was a little off on the year when it would all go down–1984 was more the year of the big hair band than Big Brother (not that this wasn’t equally terrifying in its own right). And today’s Thought Police do not use Orwell’s Telescreens to monitor us for…
Read More » -
Anti-Science
Bad Chart Thursday: Public Displays of Affection
I wasn’t going to do a Valentine’s Day post. It’s a holiday that doesn’t really cross my radar except for maybe the prospect of discounted candy after it’s over. But even then, it pales in comparison with Halloween. If Halloween is a full-course meal, Valentine’s Day is the mint you get with the check. I usually toss those mints in…
Read More » -
Anti-Science
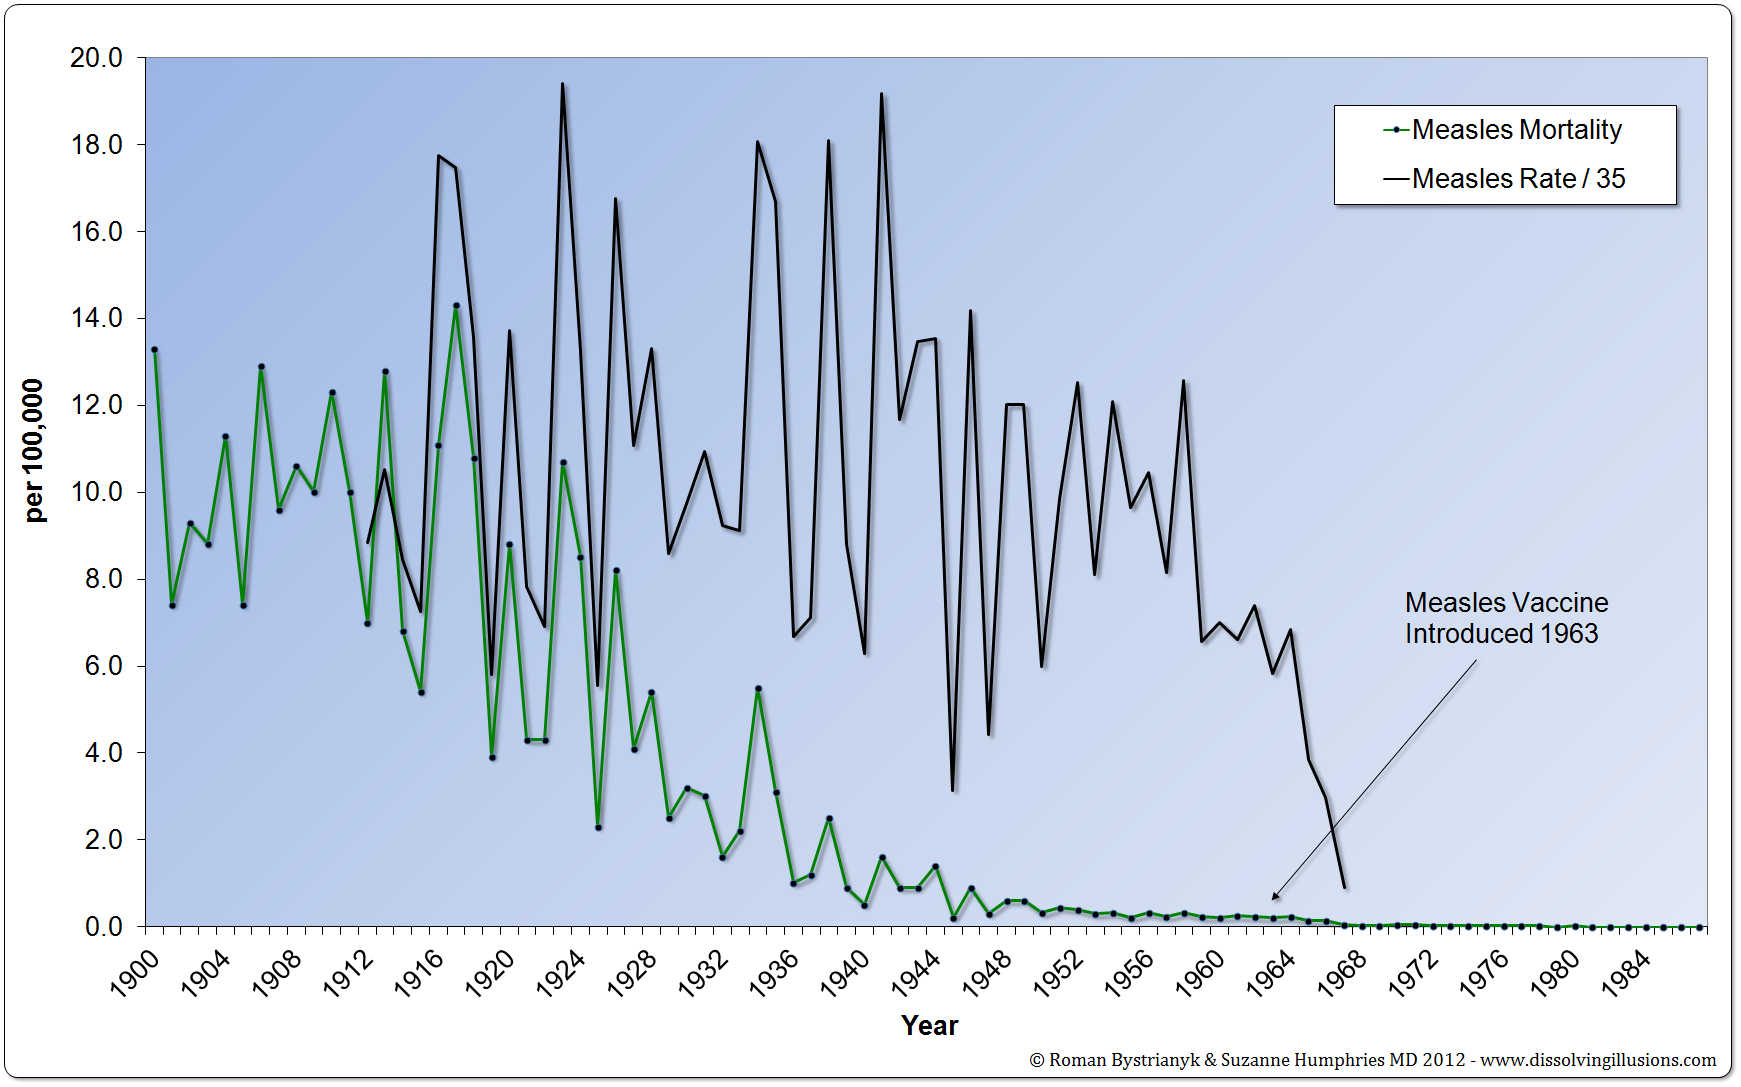
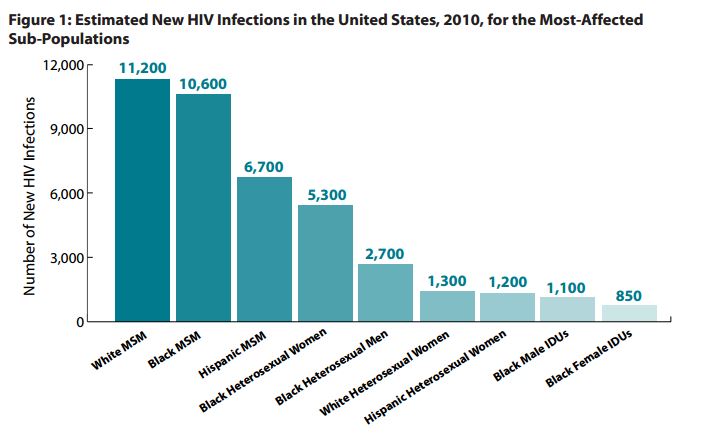
Bad Chart Thursday: The TRUTH about Bad Measles Charts the Mainstream Media Is Suppressing
Roman Bystrianyk and Suzanne Humphries have a cherry to pick with proponents of vaccination. Their article on the measles vaccine was recently published on Health Impact News’s Vaccine Impact website under a heading promising us a mouthful of impacted truth: The Truth About Measles the Mainstream Media is Suppressing. The actual article by Bystrianyk and Humphries is titled “Was the…
Read More » -
Featured
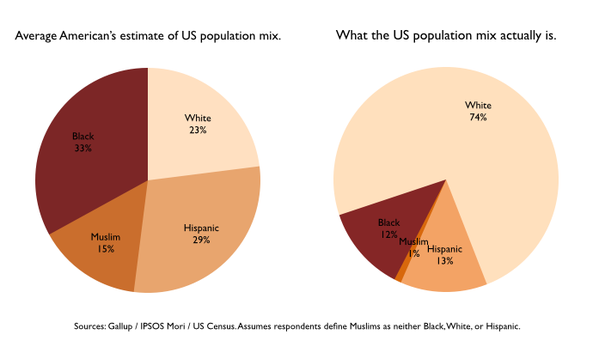
Bad Chart Thursday: Redefining Race
So you want to make a point about Americans’ skewed perceptions of race? Step One: Don’t use a racist chart. Even if your heart is in the right place. Even if you really, really didn’t mean to be racist while making what you thought was an anti-racism point. Step Two: Educate yourself on what “race” means in the context you’re…
Read More » -
Featured
Bad Chart Thursday: #SOTU Edition
The State of the Union now comes with full-color illustrations, which is nice for the kids, Powerpoint addicts, and anyone who wants to add another layer to the SOTU drinking game. Don’t worry, you can just create a new liver with the 3-D printers that will soon be on every street corner. I think “up to” is my favorite spin…
Read More » -
Featured
Bad Chart Thursday: New Years Linked to Autism
Shocking news from the unironically named website The Mind Unleashed: “MIT Researcher’s New Warning: At Today’s Rate, Half Of All U.S. Children Will Be Autistic By 2025.”* Autism: a fate worse than death for self-absorbed parents and people who benefit from demeaning those on the spectrum. It’s the go-to bogeyman for anyone who JUST KNOWS something is harmful but can’t…
Read More » -
Random Asides
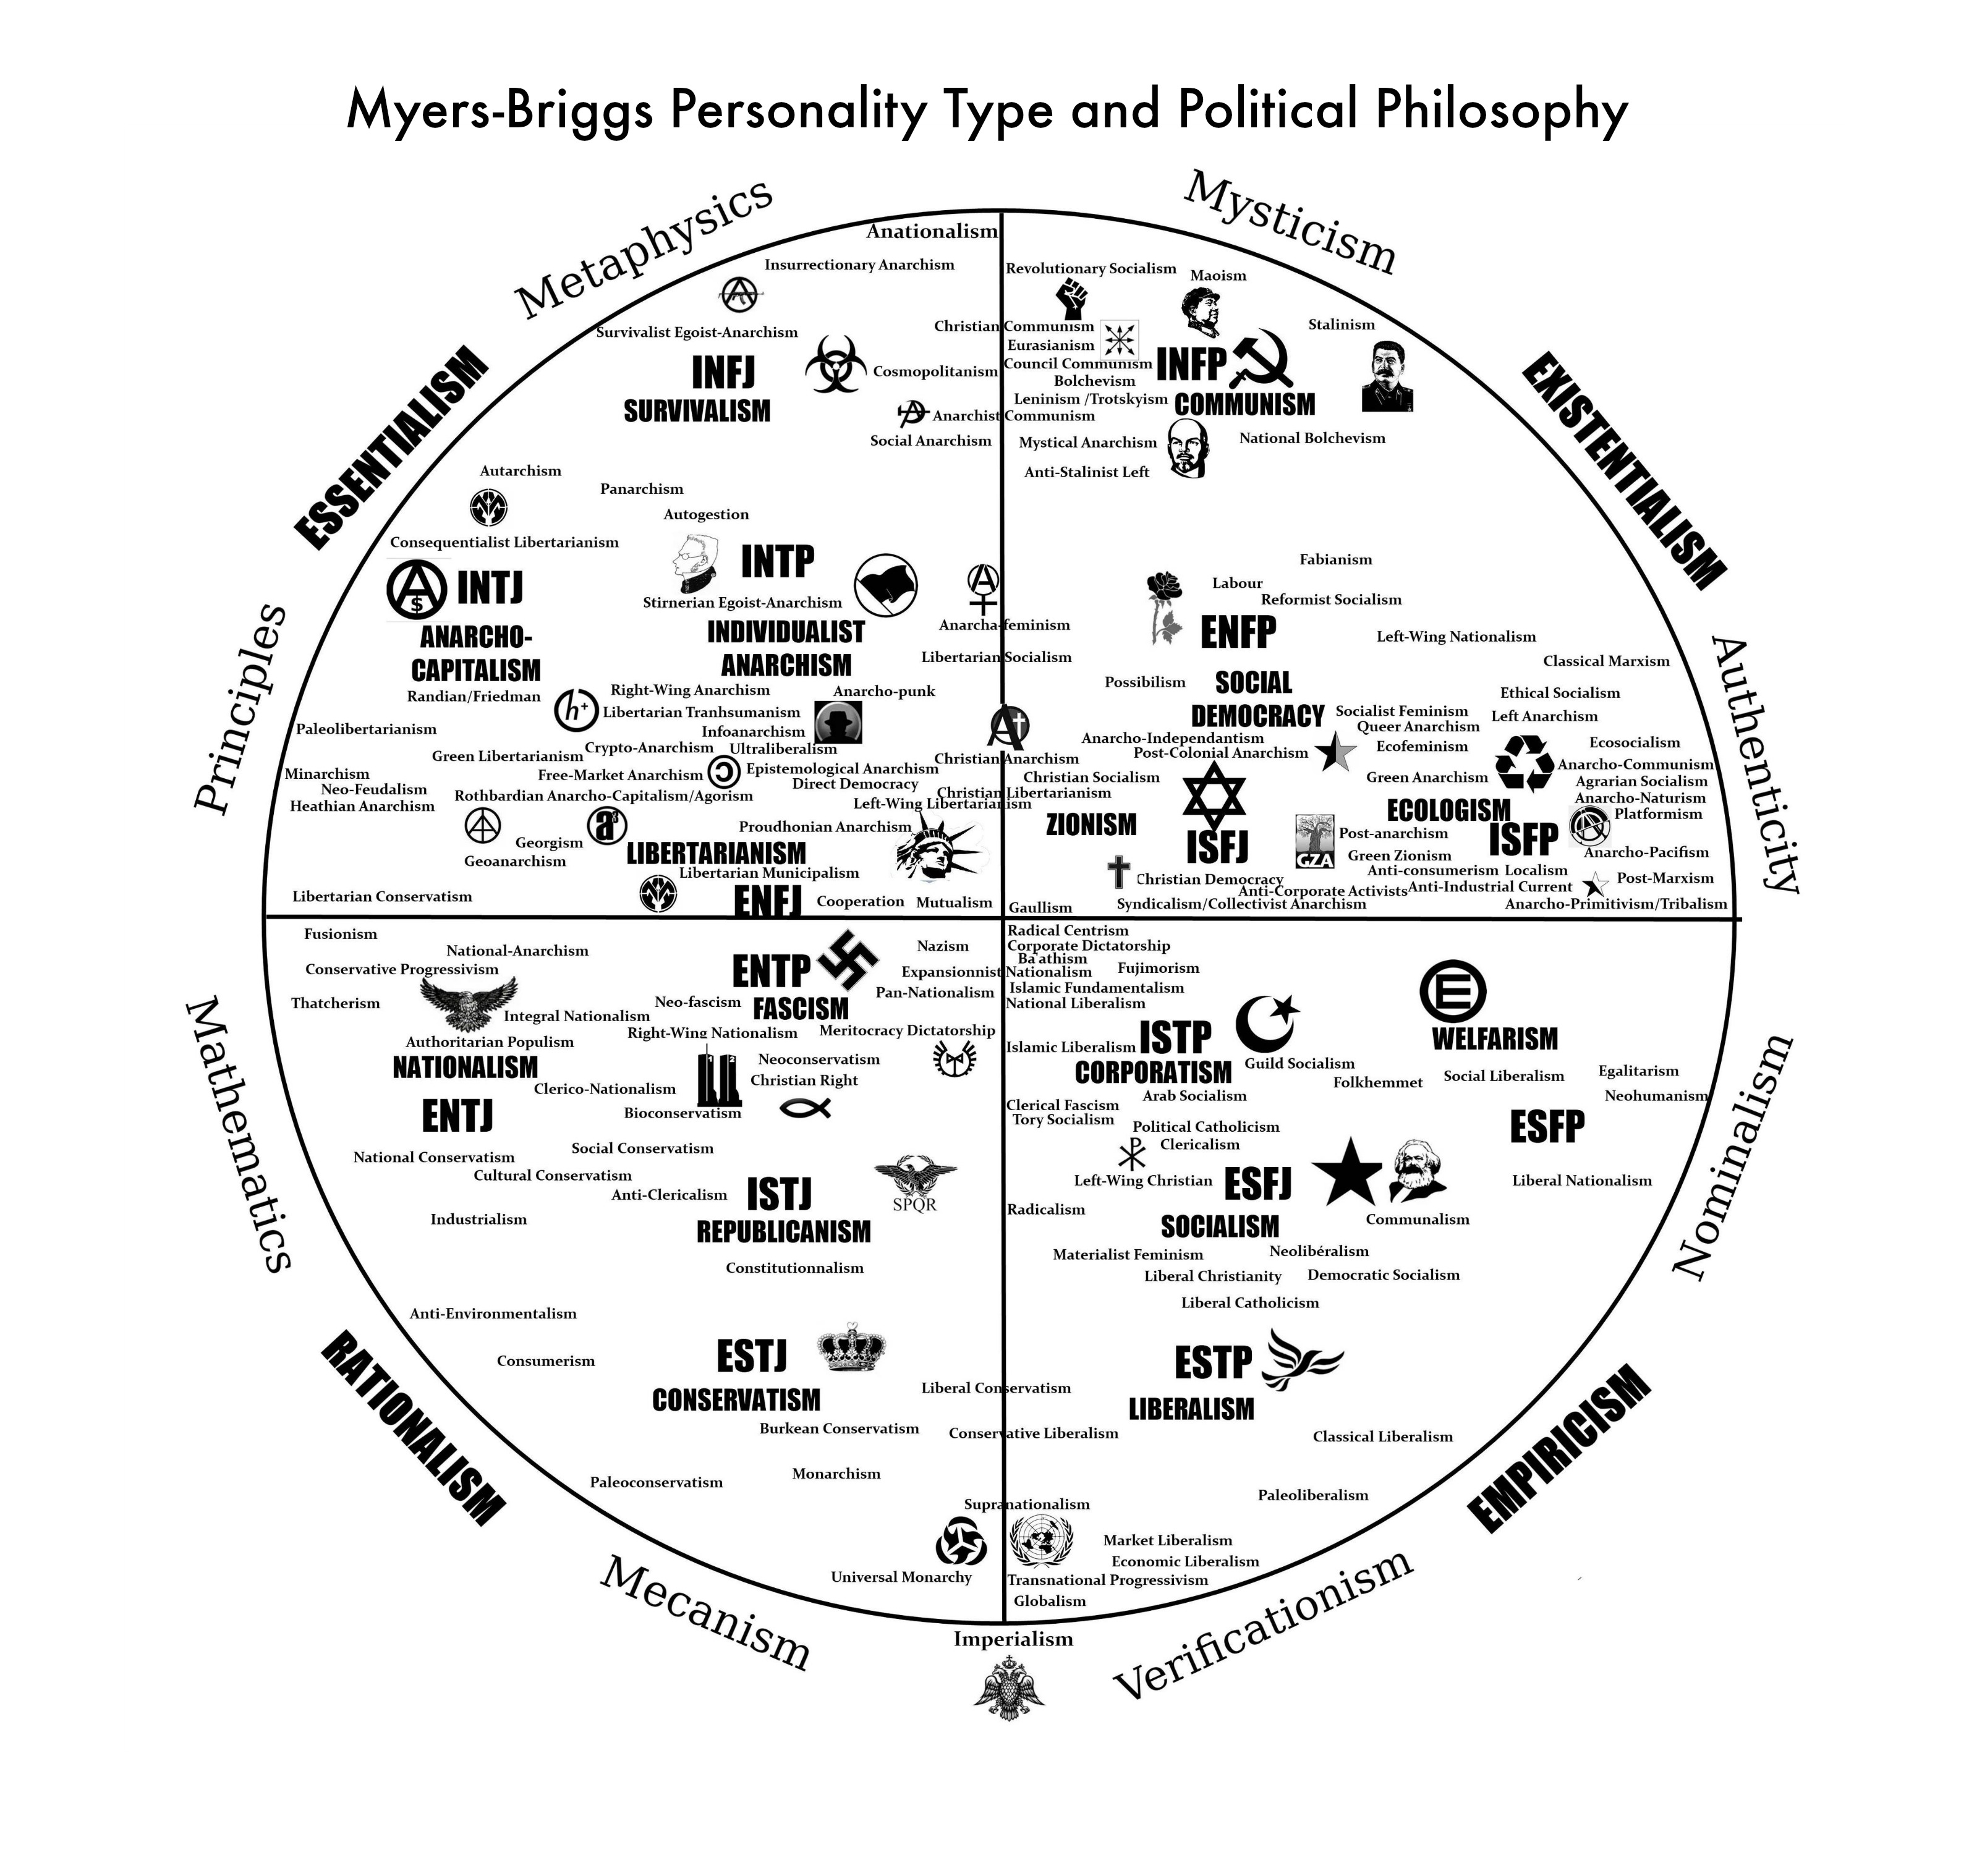
Bad Chart Thursday: Who Are You?
I took the Myers-Briggs Type Indicator, a personality inventory, in high school, and when I got my horoscope results, I admit that I was pretty amazed at how well it described me—and, apparently, Hitler. Then I read the results of other people in my class, and I was amazed at how well their results described me too. Years later, I…
Read More »
