This month researchers* from Arizona State University, University of Iowa, and Pennsylvania State University came out with a study entitled “Women Selectively Guard Their (Desirable) Mates From Ovulating Women,” (apologies for the paywall) which they say proves that women can tell when other women are ovulating and subconsciously try to keep those women away from their man. According to the researchers, in ancient human times slutty ancient ladies would always be trying to steal sexy ancient men away from their frumpy ancient wives. This man stealing was more successful when women were ovulating because when the right time of the month comes around innocent virginal women turn into sex-crazed husband-stealing hussies. This is where all our werewolf myths come from. In order to protect against these sexy werewolves, wives learned to subconsciously detect when other women were ovulating and then manipulate their husbands into staying away from the lady-beasts.
Sure, this sounds like a joke, but this is the actual theory that this entire research rests on. Here it is as the researchers explain it:
Ovulation may make women both more attractive to men and more sexually attracted to (some) men. Moreover, women face high fitness costs at the defection of a partner and the diversion of his resources. Thus, we predict that partnered women will be especially ware of ovulating (relative to nonovulating) potential interlopers, and that cues of ovulation will evoke a mate guarding psychology in these partnered women. As a consequence, we expect that partnered women will want to socially distance both themselves and their partners from ovulating women. Such desires may facilitate women’s mate guarding by precluding potentially costly competition over their committed mates.
Based on this sexy werewolf theory, the researchers designed a a bunch of tests in which they recruited engaged and married women (in some cases not even bothering to actually make sure they were in an opposite-sex relationship) to take a survey. In some cases they showed these women a composite photo of ovulating women or non-ovulating women or actual photos of white women when they were ovulating or not. They then gave the participants a story about being at a party with this woman and seeing her across the room talking and laughing with their male partner and touching his arm and asked the participants to give their thoughts about this woman and any potential “mate guarding” actions they might partake in.
They determined that when women believe their partner is desirable or sexy to other women, they tend to increase their mate guarding against ovulating women. But, if they do not deem their partner desirable or the rival woman is not ovulating, they don’t bother with any mate guarding behavior. In other words, women can sense ovulation in other women and become more jealous when those women are around their man.
Or so they say. This was a long and convoluted study that after reading only left me with more questions about how they could have possibly come to that conclusion based on their own data.
Rebecca made one of her Patreon videos on some of the most glaring problems with this study, which you should definitely check out. This post is going to go over those problems and even more subtle issues with this study in a lot more detail, so you may want to start with her video to get the overall gist and then come back here to delve into the weeds.
Who took the study?
The most important thing to note in a study like this is who the participants were. These researchers are claiming to have discovered something new and universal about human women that was evolved from ancient humans. That is quite a claim. So, one of the first things I’m interested in in terms of evaluating the study is who took the survey.
Unfortunately I can’t actually evaluate this because the researchers give almost no information about the people they surveyed. They do say that they were recruited via Amazon’s Mechanical Turk and for each of the studies they did they give the number of people who took the survey, their average age, and the age standard deviation. They don’t provide any additional information. We don’t know what countries these women were from or what percent were engaged versus married or how long they were married. We don’t know their ethnicities. We don’t know their sexuality other than that in some studies they said all participants were heterosexual, though what they mean by that is unclear. Reading it I was unsure whether by “heterosexual” they meant that the marriage was opposite-sex or that the participant self-identified as heterosexual. In the study that didn’t specify that participants were heterosexual, were non-heterosexual women included? Were these marriages monogamous or did they include participants in polyamorous relationships? Were all the surveyed women cisgender? Were their partners?
Also, when I said they gave us the number of participants in each study, I mean that only partially. In many of the studies, the researchers stated the total number of people who took the survey but then admitted that not every participant filled out every question. Instead of dropping people who missed answering some question, they included participants with missing questions. However, their study is based on a series of models and anyone who has ever built a model knows that it doesn’t deal with missing data very well. If one of the elements of the model was missing for even one participant, the model cannot handle that and will either not include observations with missing data in the analysis, or include it as a “0” answer, potentially biasing your results. In order to deal with missing data, researchers typically drop those observations or do fancy statistical methods to deal with them without overly biasing anything. If the researchers did any of this, they do not say. It’s possible they did drop participants from some of their models if there was missing data, but it’s not clear how many were dropped or how many remained.
Reading this study, there were so many questions I had about the group of women that were surveyed, particularly because the researchers are trying to extrapolate universal human nature from these groups. But since they provided almost no information, its impossible to tell whether the groups that were surveyed were all middle-class straight white cisgender American women in monogamous relationships or whether they were an incredibly diverse groups of individuals. It’s already problematic that the photos they used to represent the rival woman were either composite photos (which tend to look white) or actual photos of white women. The researchers said they specifically only chose photos of white women, but it’s unclear why, especially considering that they are trying to extrapolate human nature from their results.
What are they actually measuring and how are they measuring it?
In studies such as this one, the researchers are measuring human traits, but since things like “partner desirability” cannot be measured in a perfectly objective manner, researchers instead have to devise a series of survey questions to indirectly measure each trait. Things aren’t always as straight-forward as it may seem. Ask questions that are interpreted differently by the participant or inadvertently are affected by a completely different trait that you weren’t expecting to measure, and you may end up with results that are not actually telling you anything useful about the thing you are studying.
The researchers devised a series of questions in order to rate participants on a whole bunch of traits such as partner desirability, partner sexiness, self-distancing behaviors towards the rival women, partner-distancing behaviors towards the rival women, and many more. However, they provide no additional information on how they know that the questions they devised actually measure the things they claim to be measuring. For example, they measure “partner desirability” by asking questions about how the participant believes other women view their partner. Perhaps respondents are lying and claim their partner as more desirable because they believe that it makes them look better if they are partnered with someone desirable.
This may not seem like a big deal, but in fact, having non-robust survey questions could completely tank their results. For example, in many places in the paper the researchers mention that previously studies have shown that women are more attracted to men and more into sex and flirting when they are ovulating. In fact, their entire paper is premised on this notion. And yet, they did not seem to obtain any information about the cycles of the survey participants. If the researchers are right that ovulating women view men as sexier and more desirable, it might be that the participants who took the survey while ovulating rated their partners as more desirable. It’s also possible that ovulating women have more jealous feelings towards other ovulating women than do non-ovulating women. If both of these are true, then the survey results would make it seem as though women with more desirable partners were more jealous towards ovulating women when in truth it’s just that ovulating women are more jealous towards other ovulating women, regardless of their partner’s sexiness. This could come about if the researchers measures of partner desirability are actually measuring participant ovulation. This is why it is so, so important that the researchers be as sure as they can be that they are truly measuring what they think they are measuring.
Additionally, they provide no information about how respondents actually answered these questions. For each trait, respondents were rated on a scale of one through seven (actually -3 to +3 but then converted to a seven point scale with one being the highest amount of a trait). However, it’s unclear what the variability in responses actually were. For example, did all participants rate their partners at a high desirability of 1 and 2 with maybe a couple 3’s? Or did the results form a normal distribution with an average of 4?
It’s really important to understand the distributions because later they feed this data into models and what the data looks like makes a big difference as to what the best type of model to use is. Some models do best with normal distributions and others with highly skewed data. Additionally, if they don’t have enough variability in the responses, then it is impossible to measure how people who answer very differently respond.
In other words, let’s say everyone who took the survey found their partners desirable and answered with either a 1 or 2. The researchers’ conclusions make the claim that people who find their partner’s desirable react differently to an ovulating rival than do participants who do not find their partner desirable. However, if they don’t actually have anyone who took the survey that ranked their partner as undesirable, then how do they know that women with undesirable partners will act any differently?
We cannot assume that because the researchers came to this conclusion means they had examples of people with undesirable partners. For purposes of their conclusions, they determined high-desirability vs low-desirability by those that fell above and below one standard deviation on this measure. Since they don’t provide the average or the standard deviation, it’s possible that what they are claiming is actually comparing women with highly-desirable partners versus those with slightly less highly-desirable partners.
Again, the researchers just do not provide enough information to even evaluate whether their methods were sound in their forms of measurement and whether we can trust their results based on those measures.
What is a model?
As I mentioned earlier, this study used models to come to their conclusions, so in order to understand what they are doing and evaluate it, we need to know what a model is and how they are used. In its simplest form, models are equations that you build using your raw data. The equation itself tells you how important each thing in your model is towards predicting an outcome.
Here is a simple example of a model to predict temperature based on cloud cover:
Temperature = Intercept +BCloudCover
If we had a dataset with the temperature and amount of cloud cover for each day of the year for a city like Chicago, we could use a statistical program to determine the relationship between temperature and cloud cover. The program would process our raw data and then give us a number to represent B (sorry readers, wordpress won’t let me use greek letters so you get a “B” instead of the traditional lower-case beta) and an intercept. The intercept is the temperature when cloud cover is 0 and the B is the amount that the temperature goes up for every unit of cloud cover. Once we have the equation, we could choose any amount of cloud cover, plug it into the equation, and it would give us the likely temperature.
However, this model makes a lot of assumptions. For example, it assumes that cloud cover and temperature have a linear relationship. So, the more the cloud cover the lower the temperature. This might not be a bad model, but by adding more data points into the model we could probably make it even better.
For example, in places like Chicago there are huge seasonal temperature differences. So, although this model might do ok predicting the temperature in the fall and spring, it might not work well in the summer or winter. We could make this model take season into consideration by adding it into the model.
Temperature = intercept +B1CloudCover +B2Winter
Now our model is a bit more complex. If we reran our new equation on the raw data, we would get a new B1 which represents the relationship of temperature to cloud cover when controlling for the season. Now we could specify that the season is winter and plug in the amount of cloud cover, and we’ll get a much better prediction of the temperature.
This is how a basic model works, though they can get incredibly complex. They don’t have to be simply linear like this one is and they can even have complex variables that predict indirectly or even use statistical tricks that determine the direction of causation. Regardless of complexity, the most important thing to remember about models is that they have built in assumptions about what you expect the relationship of your data is and they will force your results to fit those expectations, so you have to be incredibly careful. When we built our first temperature model, our assumption was that cloud cover and temperature have a perfect linear relationship. If we ran that through a statistical program, it would have spit out results for us that make the model look really good, even though it had a fatal flaw that it could only predict the temperature during certain days of the year. We would have a hard time seeing that flaw only from the model. This is why we would have needed to make sure that our model was really working. For example, we could have gone back through our raw dataset and plugged in the amount of cloud cover for each day into the model then compared the actual temperatures to the predicted temperatures from our model. If we plotted how close the predicted temperatures were to being right over the year, we would have seen that it worked great during certain seasons and terrible during others. Or, if we were in San Diego where they don’t get cold winters, we may have confirmed that our original model was doing a great job of predicting all year round. Regardless, we wouldn’t really be able to know whether our model was any good until we actually tested it.
How are they using models in this specific study?
Going back to the paper in question, the entire study was predicated on models and all the results given were simulated results from these models. Every couple sentences they seemed to switch to a new model. At one point I went back through the paper and tried to count how many models they ran and I came up with at least 39 models, though they switched between them so quickly that it often wasn’t clear which numbers were from what models, so my count may not be 100% accurate. I also say “at least 39 models” because at one point they mention they ran a bunch more models that they didn’t bother to report details on because they weren’t significant.
This is really odd for a research paper. Just because a model is not statistically significant doesn’t mean it’s not important. In fact, an insignificant model could prove there is not correlation where their theory believes it should be. In other words, an insignificant model tells us important information about where there are not relationships between the data. This is as important as understanding where the relationships are. Yet throughout the paper, any models that come out insignificant are completely brushed aside.
As someone trained in statistical modeling and who reads many scientific papers which use models, I’ve never seen any other papers that run anything close to 40 models. Usually, researchers will give all their assumptions about the relationships in the data and the evidence for those relationships. Those assumptions then lead them to a specific type of model that they plan to build. This step is important because as mentioned before, a model built on bad assumptions will not always be obvious, so researchers have to make sure they are building a model that they believe will best fit the data and then they have to defend the model they are planning on using.
It’s possible that they will build a couple versions of the model, or perhaps build their first model but after evaluating it determine it’s not very good and then build another. Or, they may build a handful of models and test them against each other. Never before in any scientific paper have I seen more then a single digit number of models built. I’m not saying it never happens, but it is certainly unusual.
Not only do the researchers in this case build more than 39 models, but it’s never completely clear what those models are. They mention the variables they put into the models but not necessarily exactly what the model looks like. When reading the paper, I assumed they were building the most common type of model (known as OLS or Ordinary Least Squares) but the researchers do not actually state this at any point so it’s just an assumption.
Additionally, the researchers never give complete results for any of their models. They often mention their B’s, but don’t give the full equation or even the intercepts, so there is no way for me as a reader to test their assumptions by plugging my own things into their equation to see if it always makes sense.
I mentioned earlier that model results can be misleading, so typically researchers will evaluate how well their model fits their data. Generally statistical programs will give you some standard measures to evaluate the model fit, which includes an evaluation of the statistical significance of the model, how much of the individual variation can be explained by the model, and how well the predictions fit the data. These are standard measures that are generally reported in every paper that uses a model, and yet in this paper they build tens of models and don’t give us any information to evaluate even one of them. Their models could be perfectly predicting their outcomes or doing only slightly better than random and I have no way to tell because they don’t put any of this in the paper. Honestly, it’s unclear if the researchers themselves did any evaluation of their models at all. Perhaps they did and they just didn’t mention it in the paper, but I have no way to know.
The researchers do bother to give us most of theirB values for each model variable along with their p-value, a measure of significance. In most cases, even when their results are significant, they are barely so. So yeah, they often meet the researchers very lax statistical significance threshold, but are so close that if there were even the smallest amount of research bias present, it could have easily pushed it over the threshold into significance.
Another problem with using so many models is that the researchers could easily find themselves participating in p-hacking. P-hacking is when researchers test so many different things that they are bound to get some statistically significant correlational results even if their raw data is completely random. In other words, correlational research is a statistical game where the correlation may or may not exist but results that look correlated could be caused by randomness rather than an actual relationship. The higher the statistical significance the more you can be sure that the relationship truly exists and is not just a random product of the data. If you test enough things, you’re bound to randomly come across correlations. If you test a whole lot of things and the only correlations you have are very spurious and often disappear when you look at the data in a new way or you come across correlations that don’t make any logical sense, it might be pointing towards really deep flaws in your research methods.
In this study, they run model after model, some of which come up with barely significant results. When they run similar models on different data, often the results disappear completely or they get results that seemingly make no sense with their original theory. It seems to be a pattern in their data that the studies with smaller numbers of participants show the most significant results, results that get less and less significant in future, bigger studies. The researchers do not provide any evaluation information on any of their models to really understand how well they actually fit the data or even the basic assumptions that went into their model, so even when they get significant results, we aren’t able to evaluate whether those results are truly representative of the data or completely misleading.
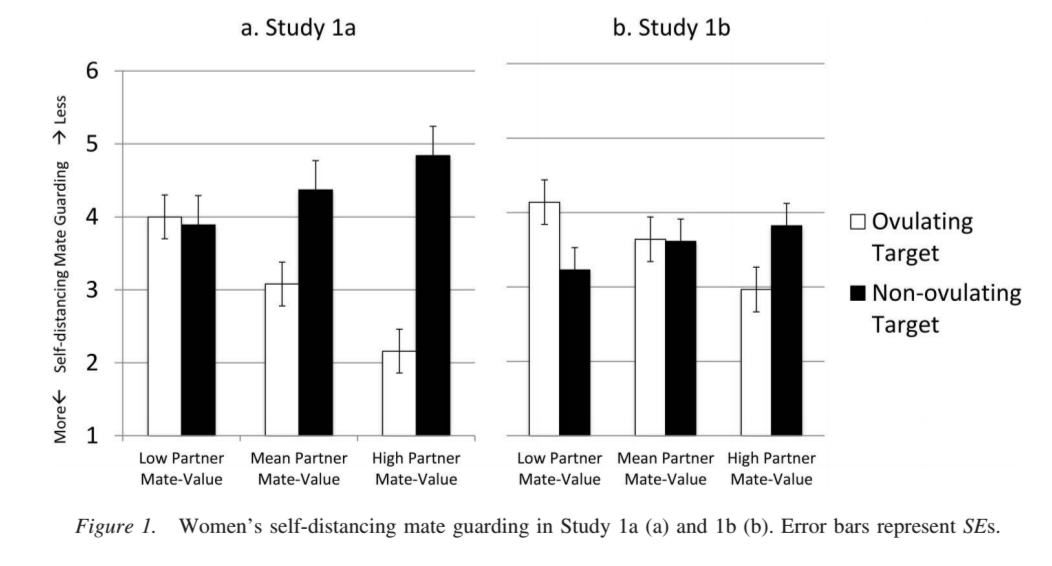
The charts they provide in the paper are incredibly misleading.
In the paper, the researchers put a bunch of charts similar to this one showing the amount of mate guarding behavior present in women with desirable partners versus less-desirable partners towards women who are or are not ovulating. The first thing to note is that their y-axis is upside down from what any reasonable person would expect. The y-axis is the measure of mate guarding behavior. However, the lower on the y-axis you go, the more mate guarding behavior was present and the higher you go the less mate guarding. So, the bigger the bars, the less mate guarding behavior.
The researchers used “1” as the highest and “7” as the lowest, which must have been why they did the chart the way they did, but it still seems like an odd choice. They could have easily put 7 on the bottom and had the y-axis count down. It would have been a little odd having the numbers backwards on the axis, but it would have made the chart much more intuitive to readers.
The second major thing to note is that literally nothing on these charts shows the actual survey results from the actual women that took the survey. The charts represent only simulated data from their models. In other words, they created their models using the raw data then plugged some theoretical numbers into the model then put the results into the charts. When they state that women with more desirable partners scored higher in mate guarding against ovulating women than women with less desirable partners, they aren’t saying that of the group of women in their sample with highly desirable partners, they had an average mate guarding of 3.8 against non-ovulating women and 3 against ovulating women. It’s just that they plugged a hypothetical women with a highly desirable partner into their model and the model predicted that these would be her results.
Since their models were generally really simple, containing only two inputs, both of which are present in their charts, I’m not really sure why they couldn’t have reported on the actual averages for the groups of women. Doing so would have confirmed that their model is reflecting the underlying data well and added a second piece of evidence to support their theory. It’s unclear whether they ever did this as part of the study and just never reported on it or whether they never bothered to look at it at all. As I mentioned earlier, they give no information on even basic averages for any of the data that came out of their survey.
So many inconsistencies
Again, they ran over 39 different models. Sometimes their results fit their expectations and they in turn reported it as such. However, sometimes they got insignificant results. In many cases, they followed it up by pulling out a subset of the data then re-running the model only on that subset, possibly getting a significant result.
This is a common practice within p-hacking. If at first you don’t get the results you were expecting, split the data into subsets then test each subset until you do get the result you want. As mentioned earlier, if you keep looking for correlations, eventually you will find them even if they aren’t actually real but just a product of the data. Splitting the data into pieces is a good way to be able to run more correlations and maybe find something that is statistically significant. And by “good way” I mean, terrible way because it will greatly increase your chances of getting statistically significant results even when there is no actual relationship between your data points.
Just to be clear, I’m absolutely not saying that the researchers are doing this on purpose in order to manipulate their data. Instead, I suspect it’s because they really believe they should be getting certain results and are inadvertently biasing their own data until it matches their expectations. As a researcher, it’s really easy to come up with a slightly new theory that would explain why your results weren’t what you expected but how maybe if you just looked at it in a bit of a different way, you might be able to see it. In other words, it’s really easy to trick yourself using your own theories. This seems like exactly what is going on in this paper. Whenever results aren’t significant, the researchers have an excuse at the ready that will slightly tweak their original theory and make it seem as though running the model again on a smaller subset just makes the most sense. Then lo and behold their results become significant! They then will rerun all their models on just the subset. They also at some points do the opposite of this and combine insignificant data from different studies and different samples (often in unclear and highly suspect ways), then claim that combined the data is now significant. This practice is how they ended up getting to over 39 models in their full paper.
Additionally, sometimes their models come out with super weird results that seemingly disprove their theory, but the researchers never comment on it or try to explain it. For example, their main models that they use to prove their original theory correct show that women with high desirability partners are statistically significantly more likely to mate guard against ovulating women then against non-ovulating women. This result seemingly proves their original thesis that women subconsciously detect when other women are ovulating and keep them away from their desirable partner. This is the foundation for the conclusions of their paper. Look at it a little closer though and things start to break down.
When looking at this chart, just ignore the left chart for Study 1a. Study 1a only had 38 participants, which is laughably low to build a model on, so it’s not even worth paying attention to. Study 1b on the right had a slightly more reasonable 101 participants, so for the purposes of this exercise, we’ll just be looking at those.
If you take another look at this chart, you’ll see that that in fact women in study 1b with high-desirability partners do show more mate guarding against ovulating women than non-ovulating women (remember that the y-axis is upside down so the lower the bar the more mate guarding was present). However, there are two other weird things going on here.
If you look at the women with low-desirability partners, you’ll see that in fact they are statistically significantly more likely to mate guard against women who are not ovulating compared with women who are ovulating. Taking all their data and their original assumptions into consideration, this is a super weird result. It means that women who consider their partners low-desirability sense that other women are ovulating (and therefore might try to steal their partner) but then don’t seem to care, perhaps because their don’t see their partners as worth stealing. But, when the other women are not ovulating (and therefore unlikely to try to steal their partner) they suddenly go into jealous mate guarding mode and try to keep the rival woman away from their man.
This seems to completely disprove their theory and imply that something else really weird is going on with their data. However, the researchers never comment on this result. They act as though it doesn’t exist at all even though it’s completely discordant with the thesis of their paper. In other words, they base their conclusions only on the subset of women with highly desirable partners (16% of each of their datasets or in the case of study 1b, 16 individuals) and completely ignore the rest of their data because the results are no longer consistent if looking at 100% of the women in their samples.
Secondly, they use a really strange definition for “mate guarding.” They measured mate guarding in two different ways: Self-distancing and partner distancing. Self-distancing consisted of asking the participant questions such as how much they would like to be friends with the rival woman or whether they would avoid her. Partner distancing consists of keeping their partner away from the rival woman. I know that when I hear the term mate guarding, I assume they mean the latter. In fact, the latter definition is the only one that makes sense with their original theory that women try to keep other ovulating women away from their desirable partner. However, half of the results in the paper for their latter measure were insignificant while the former was much more likely to be significant. So, when they state their final conclusion that women with highly desirable partners showed “mate guarding” against ovulating women, they are not saying that those women were in a literal fashion guarding or distancing their mates from the rival woman. Instead, they showed no mate guarding at all and only seemed more likely to want to self-distance themselves. In other words, women with highly desirable partners who saw an ovulating woman talking to their man were less likely to want to become friends with her but were ok if their husband befriended her. In case you didn’t notice, this actually disproves the conclusions of the entire paper. However, the researchers take this, call it “mate guarding” and claim it proves all their theories.
If you think about the actual implications of these results a little more deeply, they don’t make any kind of intuitive sense, even by bullshit evo-psych standards. They found that women with highly-desirable partners were less likely to want to form a friend-relationship with an ovulating women but not with a non-ovulating women, presumably because an ovulating woman might poach their man, so best not to form a relationship with her. However, ovulation lasts only a couple days and then the ovulating woman will become a nonovulating woman. Plus, the nonovulating women that would be more likely to be befriended at the hypothetical party, will later likely become an ovulating woman. So, even assuming the evo-psych theories about women sensing other women’s ovulation and distancing themselves is true, it wouldn’t make sense that women would want to distance themselves long-term by not forming a friendship with another woman just because she happens to be ovulating when they first meet. At no point in the paper do the researchers bother to tackle the long-term distancing question and how it wouldn’t make sense considering that ovulation is a temporary yet recurring phenomenon.
Conclusions
This study was written in such a convoluted and confusing manner that it almost seemed as though the authors were doing this on purpose, such as for one of those fake studies that researchers submit to legitimate journals in order to catch them in the act of publishing terrible studies. It really was that bad. At no point did they lay out the actual equations for each of the models they used. Often in one paragraph they would switch from one model to the next and it wasn’t always clear which sentence was describing results of what model. As mentioned before, their charts had the Y-axis upside down from what makes intuitive sense, so even trying to understand their basic charts was a chore.
This could actually be a really well-done study, but it’s impossible to tell from the published paper because their methods and results were so unclear. It’s not clear what the characteristics of their population was. It’s not clear what types of models they used or why they chose them or how well those models matched the data. The fact that they built so many models in the first place and then kept running them over and over again with different combinations of the data would make their research vulnerable to p-hacking.
Even if we assume everything about their study design was perfect, their results were underwhelming. Only parts of their data showed positive results that matched their theory and it was often not significant or barely significant. Other parts of their data often showed results that refuted their theory. Plus, their underlying theory itself has serious holes in it.
I certainly have no trust at all in their claimed conclusion that women can sense the ovulation of other women or that they then act on that information. Their study is completely unconvincing in just about every way possible.
* Typically I would list the names of the study authors to give them credit, but since they are probably nice people and I just eviscerated their study, I thought it nicer not to have this post come up in their personal google results. You can see the names of all the authors on the study itself.


I am completely hung up on the claim at the top of your article, that they showed people photos of ovulating women. What’s the data showing that people can detect ovulation in a photo?
And yeah, it’s all downhill from there.
The following are citations from the paper. I have not read (and probably won’t) to evaluate, but I believe there are other similar studies showing differences in attractiveness ratings to photos across the cycle.
But of course, this is not direct evidence of detecting ovulation. Is that what you meant? And if so, what do you make of these findings, if they indeed can be judged as “legit”? Of course the author’s interpretation is that males are “detecting ovulation”… do you think that is not a reasonable assumption?
Cheers
Bobst, C., & Lobmaier, J. S. (2012). Men’s preference for the ovulating female is triggered by subtle face shape differences. Hormones and Behavior, 62, 413–417. http://dx.doi.org/10.1016/j.yhbeh.2012.07.008
Puts, D. A., Bailey, D. H., Cárdenas, R. A., Burriss, R. P., Welling, L. L., Wheatley, J. R., & Dawood, K. (2013). Women’s attractiveness changes with estradiol and progesterone across the ovulatory cycle. Hormones and Behavior, 63, 13–19. http://dx.doi.org/10.1016/j.yhbeh.2012.11.007
“Subtle face shape differences”. Um…
In the paper they provided a couple pages worth of “evidence” that people can “sense” when women are ovulating by citing a bunch of other studies, some of which I’m pretty sure I’ve seen other people do take-downs of. I didn’t have the time or patience to go through each one and research it though, so I just decided to not question their underlying assumptions that their thesis was based on and instead just look at how good their methods were for testing their thesis, which of course had p-hacking red flags all over the place among other things.
It is very nice to see a true statistical analysis, as far as I can tell, on a critique (or evisceration) of a study.
I can accept the idea that women give subtle hints, like mood swings or scent signals or something, which might be detectable in an unconscious way by others. But this is so subtle and indeterminate that I would be surprised if it can be measured in any way. Certainly I would expect a solid study to show something we all had under our noses and did not see.
But the use of photographs for the survey defies credibility. This would have been a case of extraordinary claims requiring extraordinary evidence.
The amount of misinformation in this blog post is staggering. For the sake of brevity—and my own sanity—my comments here focus only on the most egregious examples.
First: the statistical information presented in this post is misleading, and at times patently incorrect. Frankly, it’s an embarrassment. A couple examples… (1) There are not 39 separate regression models in the paper. Nor is there anything unusual about the number or type of statistical analyses presented by the authors. (2) The description—and consequences—of missing data presented by the blog author is totally off the mark.
Second: I am forced to conclude that the blog author is not a consumer of psychological research, as many of her critiques target standards of the discipline. Again, a few examples… (1) The participant demographics presented by the authors are normative and sufficiently informative. Moreover, I’m puzzled as to why the blog author thinks that lack of information about the sexual orientation or gender identification of participants somehow calls the findings of the paper into question. If anything, this would simply add noise to the data and would have made it harder for the authors to find the effects that they did. (2) The graphs depict predicted means. These are continuous variables represented on a bar graph for visual simplicity. Again, there’s nothing controversial here. (3) This paper is not in some garbage publication, it’s in the flagship social psychology journal. Yet, the blog author seems to believe that the paper is riddled with glaringly obvious errors. The notion that Ms. Bernstein discovered what multiple rounds of peer and editorial review by experts in the field failed to correct is more than a little ridiculous. It’s not an impossibility, but some skepticism is warranted.
Third: The information presented in the blog post is sensationalized to the extreme. I understand that the blog author wants to be entertaining, but it’s coming at the cost of journalistic integrity. The entire first paragraph of the blog post is ridiculous, and is not “the actual theory that this entire research rests on.” Throughout the paper, the authors are careful not to overreach with their claims. They frequently report null effects. This gives me more—not less—confidence in their findings.
Fourth: This post is tagged under “feminism,” which saddens me. I get the impression that the blog author has a clear opinion on ovulation research and/or evolutionary psychology, and has allowed this (misguided) opinion to color her interpretation of the paper. There is another message that can be taken from the paper: women have sexual agency. Women are interested in sex, too. This is not an anti-feminist paper! What a shame that the blog author has perverted the paper’s findings to make it seem as though it is one.
I’ll end here with one final observation: Evolutionary psychology is real science. Unfortunately, its theoretical assumptions and findings are frequently misinterpreted by pseudoscientists (or, here, pseudo-statisticians). Please educate yourself, and put those misconceptions to rest.
1. There were around if not more than 39 models mentioned in the paper. It may be a slight miscount but they don’t make it obvious when they switch from one model to the next, but if it’s not exact it’s hardly far off.
2. You can’t run a simple regression with missing data unless you do something to “fill-in” that data (such as inserting the median or more complicated prediction methods) or use statistical tricks (such as inserting a missing value binary variable). Depending on what program you are using, running a regression on missing data will either auto-drop those observations or fill them in with a 0.
3. It’s standard to provide very basic demographic information about the group being studied. Doing so doesn’t add noise to the analysis because it’s descriptive. If you’re going to extrapolate from your sample to the entire human race then it’s important to have a diverse sample.
4. Legitimate publications publish shit all the time.
5. Sorry you don’t like the writing style.
6. Evolutionary psychology has a long history of claiming to prove racist and sexist theories. This one is certainly not even close to the worst on that measure.
7. Evolutionary psychology has a long history of making bullshit just-so claims then doing laughable studies to try to “prove” them right. Although some evo psych research is not utter garbage, those studies are few and far between, and hence why the vast majority of scientists tend to treat evo psych a small step above outright pseudoscience.
Please stop with the missing data misinformation. I don’t even want to wade into the other stuff. NEVER EVER use median imputation. There is zero literature to suggest that. Single imputation methods are perhaps the worst way to address missing data (Enders, 2010 and about a zillion other sources). “Auto drop” (or deletion methods, as they are called), would be preferable to that (although that is not best practice and would still add bias to your data). There is no “statistical trick” such as inserting a missing value binary variable that is recommended either. I suspect what you are getting out is methods for testing missingness mechanisms, and yes, you would use binary indicators of missingness. Then, assuming certain assumptions are met, best practice would be to use Full Information Maximum Likelihood Estimation or Multiple imputation.
Yes, they did run a lot of models. They had multiple outcome variables in that. They should have done some sort of correction to correct for alpha inflation. However, nothing in this paper screams that this is that much different than other areas of social science.
I’m sure there are flaws in this paper (there always are) – and perhaps there are more than other papers. I’m not going to delve into it. But this seems like a pretty bold claim:
” the vast majority of scientists tend to treat evo psych a small step above outright pseudoscience.”
do you have evidence to back that up???
I think you should be careful speaking outside of your expertise.
I never said those were best or even good ways to deal with missing data. I just used them as examples for what I was talking about, so there would not be confusion for anyone reading, particularly a lay person who may not be familiar with methods of data imputation and the like. I chose them because they were simplest and easiest to explain in the fewest words. In this paper though, they did not use any method at all to deal with their missing data. They didn’t drop it. They didn’t do any type of data imputation. And yet they managed to run many models using it.
On why most evo psych is merely a small step above outright pseudoscience, here is a good primer: http://freethoughtblogs.com/carrier/archives/9141
Lastly, I’m not “outside [my] expertise.” I’m working data scientist that regularly works with statistical models in my career and I have the degrees that got me into that position.
I still think that “Sexy Ovulating Werewolf Hussies” is a great name for a band.
And I still want to know how people detect ovulation from a foto. OK, she’s not curling up with menstrual cramps, that gives you roughly a 30% chance that she’s within her fertile window and maybe, yes maybe ovulating women are just in a better mood because it’s usually a time of the month when your reproductive system is giving you little shit (unless it’s my right ovary) and therefore maybe feeling more confident and shit. Still…
Oh my god, people; for real?
First off, other people from other labs have ALREADY replicated this phenomenon. (Some) Women report that ovulating women are “more likely to steal their dates”.
See this article in Biology Letters: Can women detect cues to ovulation in other women’s faces?
Janek S. Lobmaier, Cora Bobst, Fabian Probst
Biol. Lett. 2016 12 20150638; DOI: 10.1098/rsbl.2015.0638. Published
Second, the focal article takes great pains to NOT sensationalize the finding. It seems to me that the actual scientists who wrote it—you know, those with actual training in statistics, those who even did a Continuously Cumulative Meta-Analysis at the end of the paper because they included in that paper studies that didn’t replicate (i.e., those with p > .05; like a good scientist does)*, those whose work was peer reviewed by other actual scientists who actually bother to read the work cited in a paper and not just dismiss it out of hand because they “think they saw a take-down of it somewhere”—were incredibly measured and cautious claims they make and they ways in which they interpret their findings. Anyone who reads the article without a hatred of…whatever the blogger hates…will see that. The blogger here was not so inclined to educate rather than sensationalize. She’s wrong about missing data. She’s wrong about….you know what? A lot. There’s too much to go over.
*BTW, including and discussing non-replication in one’s own paper is a sign of the opposite of p-hacking.
Third, ironically, what could be read as a feminist take on women’s agentic behavior toward one another has been torn down by a “feminist blogger”; ironically, for those who think evolutionary psychology is evil and sensationalist, the focal article is from an evolutionary perspective, but the focal article is far less sensational than the “werewolf hussy” misinterpretation of it.
Fourth, just because you don’t like (your interpretation of) a field or (your interpretation of) some findings doesn’t make those findings untrue. Data are data, yo. Replications are replications, yo.
OK, finally, to the least dumb and most understandable question: A photo??!?!?!?!?!?!?!?!??!?!?!?!?!? Yes, a photo. You know how I know it’s true? Actual scientists have done actual science showing that men can non-consciously detect ovulation from a photo (or a gait, or a smell, or a voice or a body). This a robust phenomenon. The blogger even cites some the research used to make this claim in the focal article (even as said blogger admittedly dismisses them without reading them). There are at least seven separate studies from separate labs demonstrating this phenomenon. Perhaps you are surprised that it’s true. That’s cool that you’re surprised, because a lot of science is surprising. (Would you guys really prefer that scientists just spent their time validating what you already know about the world or only published findings that caused you learn nothing, ever?) Anyway, men find the faces of women at high fertility more attractive than the faces of THE SAME WOMEN at low fertility. It’s a thing. Men aren’t conscious that the woman is ovulating or that it’s about reproductive fitness, but they’re more attracted to the high-fertility version of the target. The end. Case closed. It’s a thing.
Now that we—who believe in data—believe it’s a thing, wouldn’t it bee cool and feminist if women could do what we already know that men could do? Oh wait, we do know it. Because this article tells us that, and so do its replications from outside labs.
And it’s actually a kind of feminist take to be like, “hey, women can do this too!”
Wow, some people really do not like having their pet theories questioned.
Did this get linked to from some where or what?
This is why we should pre-register studies!