Bad Chart Thursday: Ebola, or Cyborgs, Will Kill Us All
I don’t know about you, but the first question I ask when hearing about a tragedy on another continent is WHAT ABOUT ME?
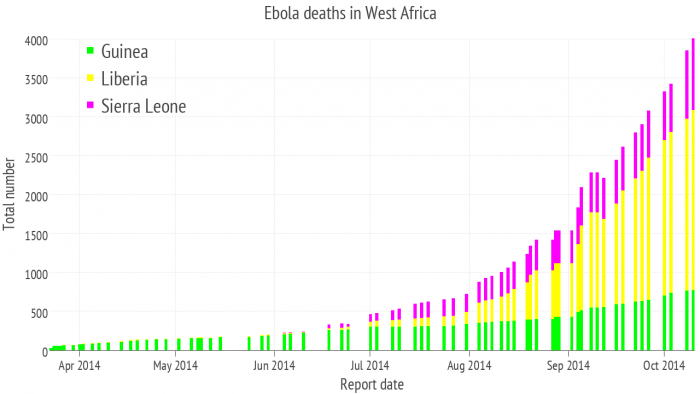
So naturally, when I read this Forbes article, “4000 Deaths And Counting: The Ebola Epidemic In 4 Charts” (the 4000 referring to deaths in West Africa alone), I thought immediately of the United States and my own safety, much like the bulk of the commenters on the article.
Perhaps the most shocking illustration of the danger to me personally is the article’s “Ebola deaths in West Africa” chart, showing the cumulative death toll over the months since the epidemic started this year for Guinea, Liberia, and Sierra Leone. I mean, if the situation is getting worse in Africa, it can only mean that a US epidemic is just around the corner (if we ignore minor details like disease transmission and other biological facts, how probability works, differences in culture, healthcare, and infrastructure, etc.). Oh, and it’s terrible news for Africa too, of course.
Perhaps JV Chamary, the author’s article, thought that a little visual exaggeration of the death toll in West Africa would lead to increased worldwide concern for and action on behalf of Africans in the affected areas who are actually experiencing this real horrible situation rather than concern for a highly unlikely hypothetical danger in the US. But highly unlikely isn’t the same as impossible. I mean, it’s highly unlikely that a piece of satellite will fall from the sky, bounce on my neighbor’s trampoline, and shoot right into my bedroom window at night, impaling me, but that doesn’t mean I don’t sleep in a titanium pod JUST IN CASE. Wouldn’t I feel foolish if I didn’t and then it happened?
So what’s the visual exaggeration I’m talking about? In the chart below, the deaths are cumulative, meaning that each successive month includes not only that month’s new deaths but the total deaths so far from previous months. So the death toll will always rise except in months when there are zero deaths (but even those months would still appear to be showing deaths).
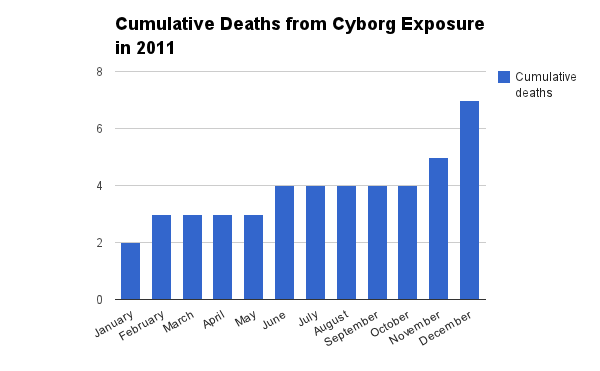
For example, below is a chart of the cumulative deaths in 2011* from what the CDC categorizes as “Exposure to other and unspecified animate mechanical forces,” which most likely refers to cyborgs (although other theories about what an “animate mechanical force” could possibly be are welcome in the comments).
But if we chart each month with only that month’s death total, the chart looks like this:
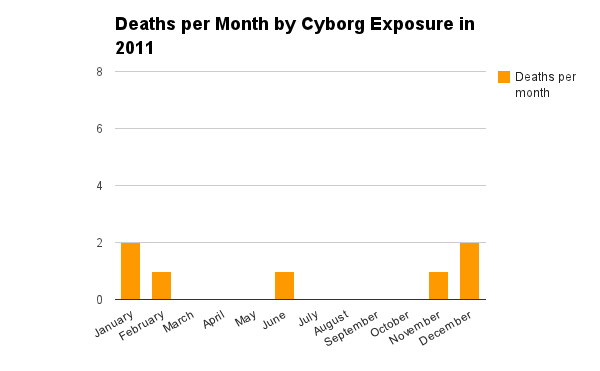
Cyborg deaths did in fact increase, as shown in the first chart, but only after decreasing, and the per month chart shows that the increase is not quite as alarming as shown in the first chart.
Still, we had more deaths from “Exposure to other and unspecified animate mechanical forces” in 2011 in the US than we’ve had from Ebola this year, so I would not rule out cyborgs as being an even more significant threat to all of our lives than Ebola is. Or a cyborg with Ebola. Fortunately, we can counter both threats by moving into underground bunkers. Except for the danger from giant moles mutated by eating GMO corn. But that’s obviously ridiculous.
*The CDC Wonder database includes data only through 2011 because they are already overrun by cyborgs clearly attempting to keep us in the dark about causes of death until it’s too late.


The CDC are such liars! The cyborgs are merely “converting” people! That’s way different than death (and I assure you, much, much worse than death.)
This is why many sources are also presenting logarithmic presentation of the same data to demonstrate that the increase in total cases and deaths over the last few months has been exponential, even though there are obvious fluctuations and surges in the spread of the disease; a couple of months ago about 25 people were dying every day; then a month ago it was about 50 p.d.; now there are about 100 deaths p.d., and the WHO is warning that the inability of Liberian authorities to manage contact tracing may mean the surge in cases there might be under-reported.
e.g. 3 related graphs at Wikipedia, 1) exponential increase vs. 2) spiky linear increase vs. 3) linear increase on a logarithmic scale.
1) http://en.wikipedia.org/wiki/File:Diseased_Ebola_2014.png
2) http://en.wikipedia.org/wiki/File:Deceased_per_day_Ebola_2014.png
3) http://en.wikipedia.org/wiki/File:Evolution_of_the_2014_Ebola_outbreak_in_semiLog_plot..png
Your third link isn’t working for me. I think the problem is the tag is closed too early. BTW, the weird double dot before the “png” is actually there. Probably a typo in the Wikipedia article.
I found the charts down at the bottom of the main Wikipedia page for the current outbreak. The logarithmic chart is
These are excellent examples of how the same data can look so different when displayed differently.
I really worry that people who don’t understand logarithms and exponents would look at the semilog chart and think, “Oh it really doesn’t look so bad” when it’s actually terrifying, especially if you live in western Africa.
I couldn’t get the link to work either! Try http://en.wikipedia.org/wiki/File:Evolution_of_the_2014_Ebola_outbreak_in_semiLog_plot..png.
I couldn’t get the link to work either! Try THIS.
Melanie Mallon,
Oh now, our machines will kill us much fast than Ebola. It will be worse than Terminator, Terminator 2, Terminator 3, Terminator whatever! We are all going to die!!!! :O
Speaking of bad charts, here are some really funny ones guys.
Atheism causes obesity, teen misbehavior, contraception and sharks!
http://liberalbias.com/post/3830/atheism-obesity-teen-misbehavior-contraception-sharks/
Also, the Cyborg chart only includes mechanical force. This includes crushing, explosions and collapsing buildings, but death rays are explicitly excluded.
So, in that graph with cumulative deaths from ebola, what happened in mid-September? Did some of the dead people come back to life?
My guess would be that something caused a hiccup at the Liberian Bureau of Statistics (I wonder what that could have been?)
Lukas, the medical diagnosis of Ebola (as a process that requires blood analysis) lags behind the number of people who present with symptoms resembling Ebola – some people turn out to have ordinary influenza or some other viral infection. Having said that, the apparent decrease in the number of deaths in Liberia around mid-September is probably a statistical artifact, perhaps due to changing the way the data is reported by the regular governmental Situation Reports – on Wikipedia from 14 September onwards they are adding together confirmed, probable, and suspected deaths to get the total figure. However they are doing that, the disease is outstripping their ability to monitor and track it.