Throwback Bad Chart Thursday: You Are Not a Special Miracle Because Odds. Sorry.
Today’s chart is actually a few years old, but it occasionally pops up in my various feeds, and the concept behind it is prevalent in multiple mathematically challenged arguments, such as those for creationism.
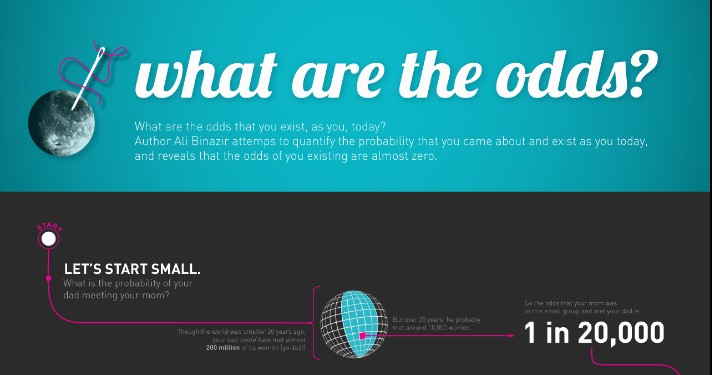
The infographic “What are the odds?” was created by Sofyay Yampolsky based on a blog post by Ali Binazir, “What are the chances of your coming into being?” You can see a larger version here.
Aside from being a bit difficult to read, the design overall isn’t really the issue. This is a Bad Chart Thursday candidate because the entire concept behind the chart is nonsense.
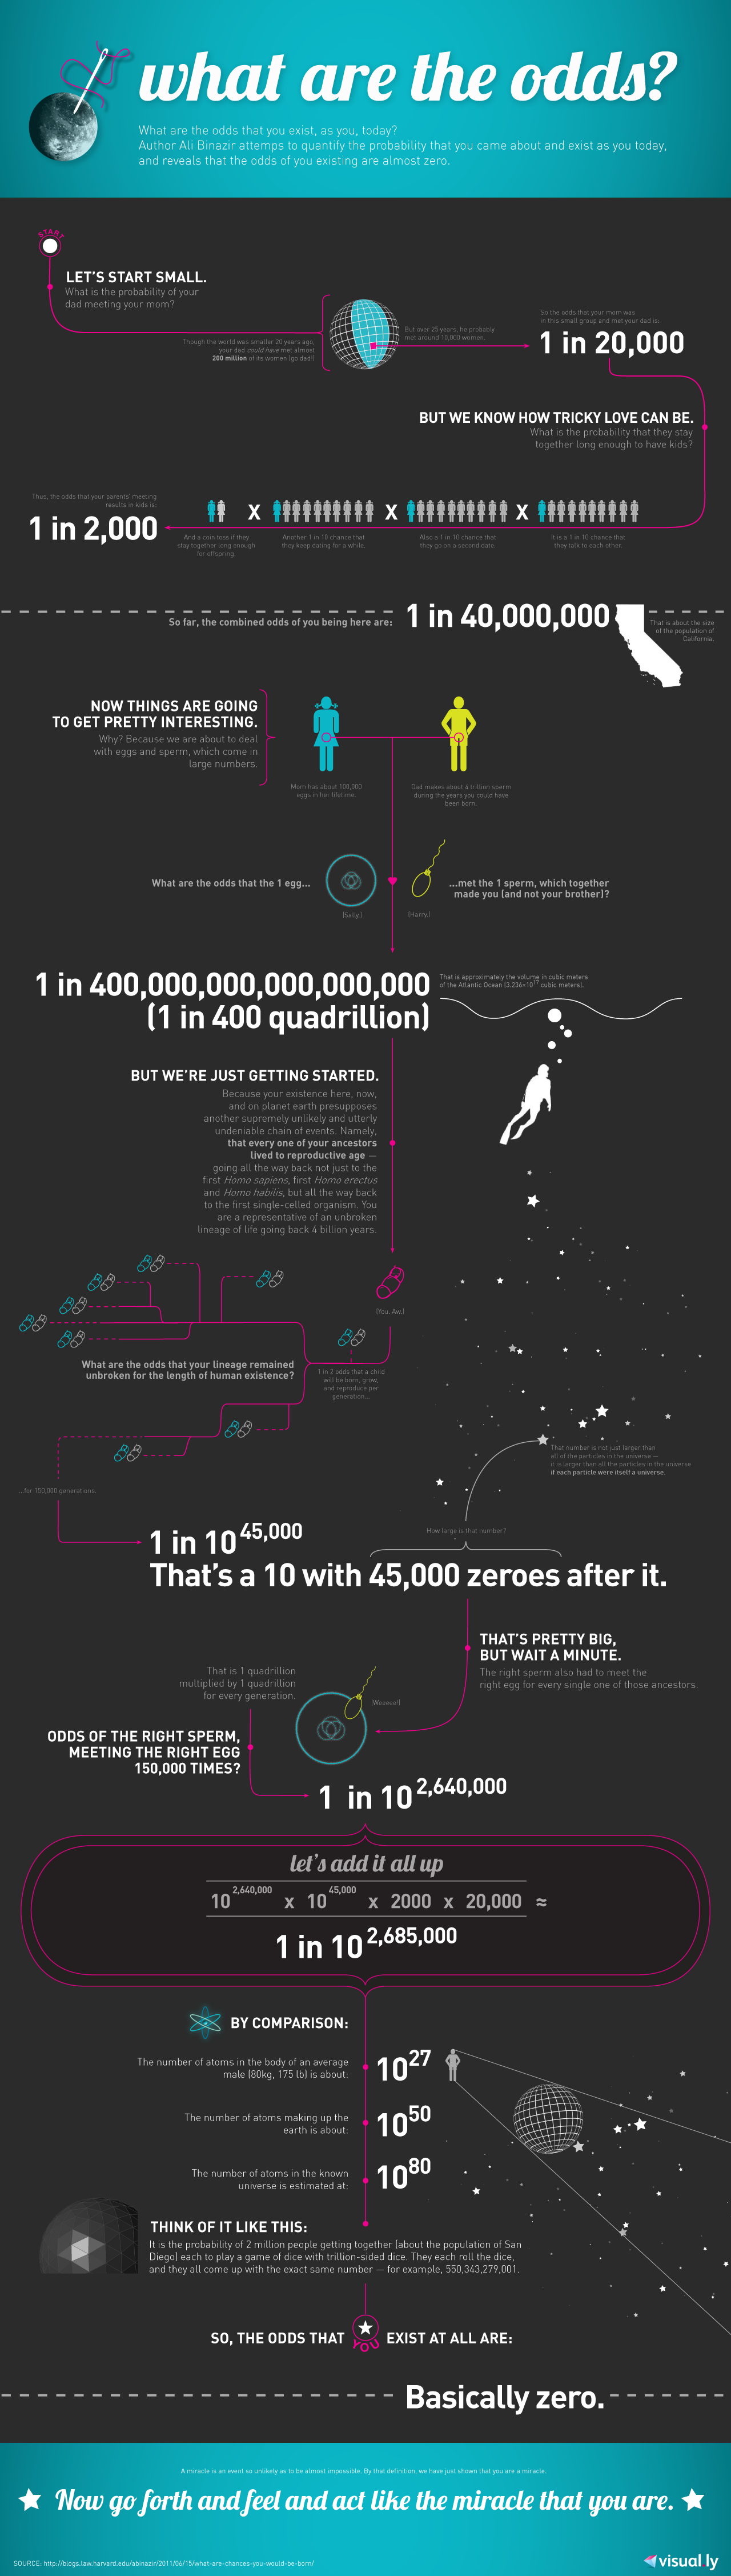
The premise is basically to take a random selection of events that would need to have occurred (ignoring many, many others) to produce you–yes, you–and add up the probabilities to show that the odds of you existing are so astronomical that they are basically zero, and therefore you are a miracle.
Now before you start blessing babies, healing the sick with your holy gaze, and selling your image in toast, consider the primary (but not only) flaw with this logic. The probability that you–yes, you–exist is not zero. It’s 1. In other words, your existence is 100% likely. Because you exist.
Calculating probability regarding events that have already happened as though this is no different than calculating the probability of events happening in the future is where the Special Snowflake Proof goes awry. Were this chart somehow made billions of years ago in an effort to predict your specific existence before it happened, that would be a completely different story, but even that points to another issue with this chart. It doesn’t actually address your specific existence. It seems like it does, but if we imagine ourselves somehow being sentient observers billions of years ago looking at or creating this chart (because chart making would be the first thing we’d do in that fantastical scenario), all it shows is a series of probabilities leading up to a unique person existing, not you specifically.
And frankly, given the chain of events, even though it is missing several factors (and almost has to because no one could fit them all in a chart), it seems highly probable that unique humans would be the end result. These aren’t random events that occur in a vacuum. Each event makes the succeeding event MORE probable, not less.
Let’s say you are the result of the heteronormative fairy tale presented here. Your parents meeting and dating would have greatly increased the odds of your being born. And odds are, other factors in their lives made it likely that they would meet and date.
Moving down the chart, even the “right” sperm meeting the “right” egg is entirely dependent on the assumption that you personally are the “right” outcome because you personally are being addressed as a miracle, but had another sperm and another egg come together, they would have still been the “right” sperm and the “right” egg for the alternate you who would be reading this. The chart does not have your name on it. Your existence can only feel like a special miracle because you exist.
In other words, the probability of your existence calculated after the fact is definitely circular, but it’s not zero. You were not born special. You’re about as miraculous and improbable as a fly in a landfill. I’m sorry. You’re welcome.
Originally published on Skepchick July 9, 2015.


The problem with that reasoning is that you have to say the odds of any event are 0 or 1, and you can’t know which until you observe which happened. It’s not very useful.
Or, to take the principle not quite as far, the odds that something happened are 0 or 1, and you might not know which. The odds that King Nebuchadnezzar had three children? 0 or 1, dunno which. Still not terribly useful.
The sort of probability that infographic is trying to use is: take a universe that operates according to laws of physics like ours. Take a description of an organism — enough information to generate it, similar to a human’s genome. What level of confidence would you have that that organism will come into existence in that universe? If you’re making an infinite number of bets on the topic, what odds would you assign to get an expected income of $0?
The linked chart still has some problems with it, but the response here entirely misses the point.
The odds of any event happening are not 0 or 1. The reasoning in this chart is not very useful because it is applying the probability of future outcomes to the past, which basically makes every event that ever happened astronomically against the odds of happening. That would make probability calculations meaningless.
The chart isn’t taking a universe that operates like ours. It is taking our universe, quite specifically. And it’s ignoring that each step along the way makes the subsequent outcomes *more* likely, not less.