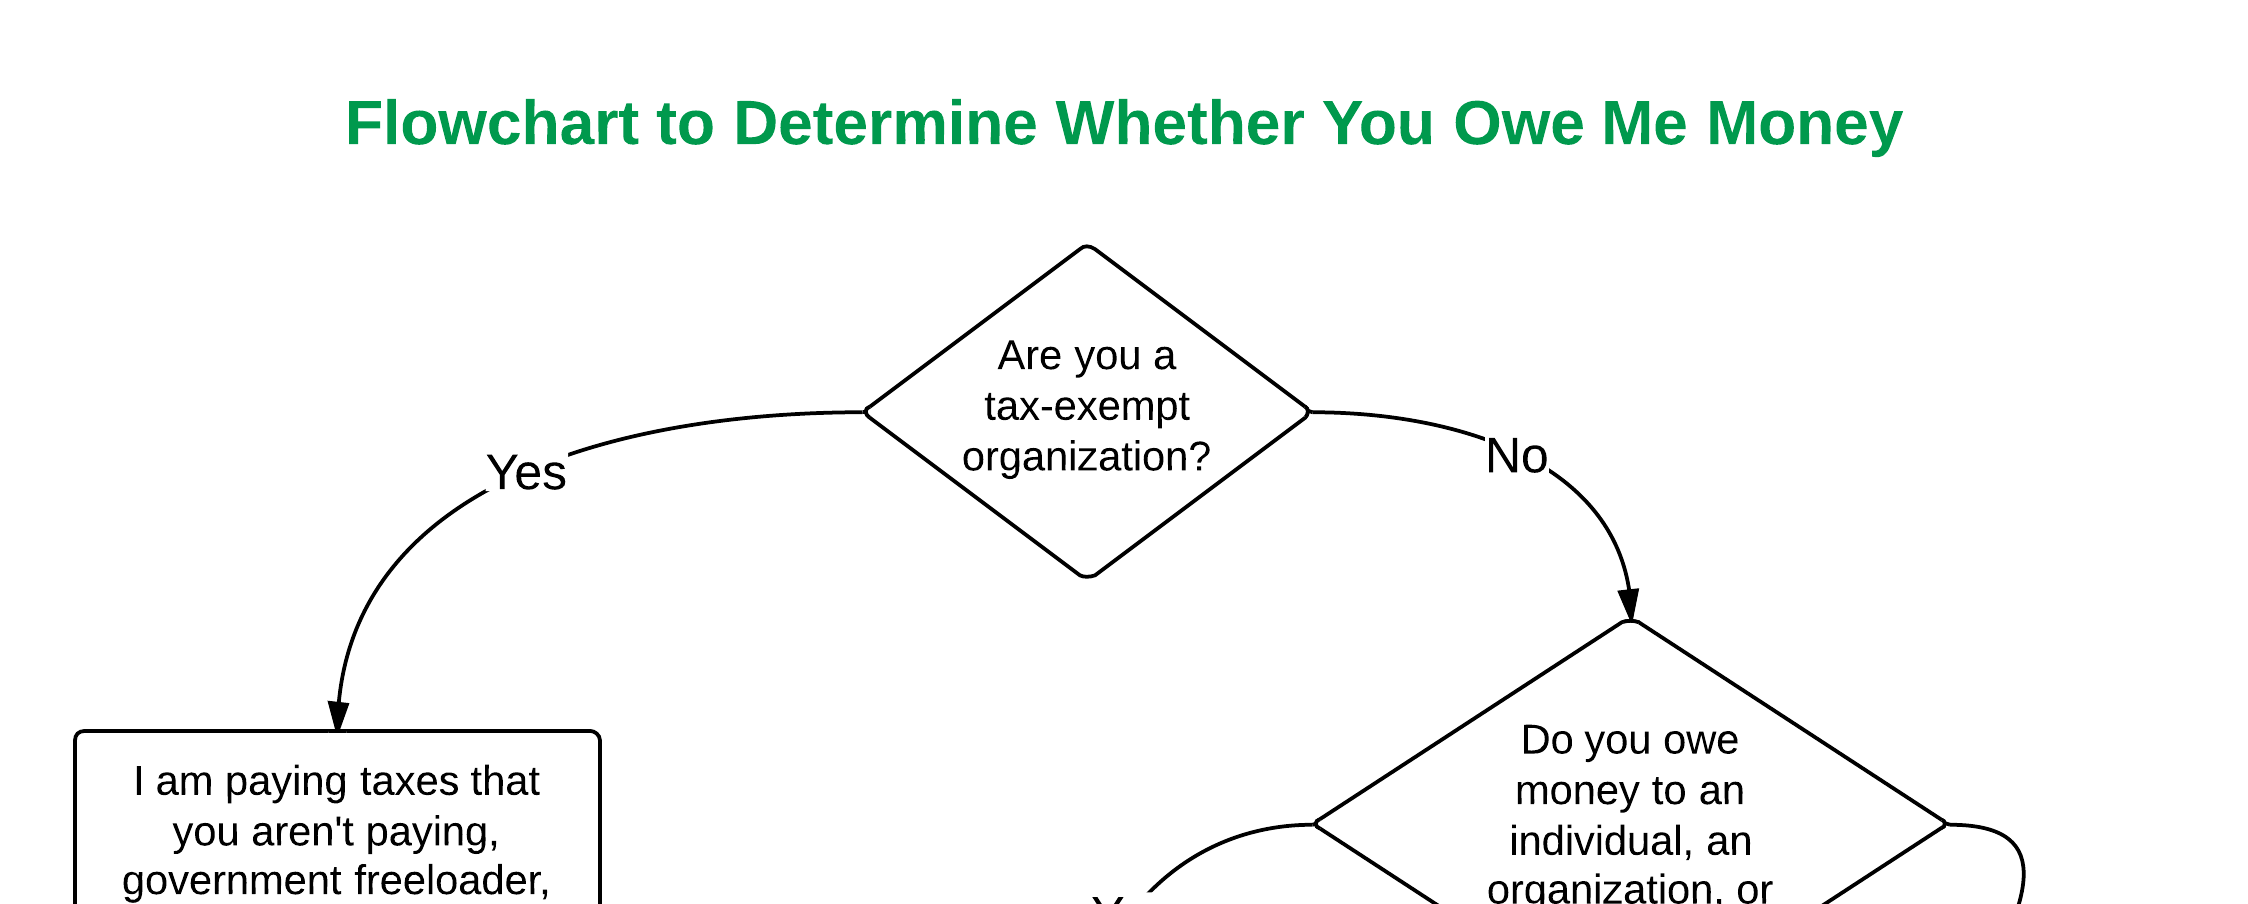
Bad Chart Thursday: Heritage Foundation Proves They Owe Me Money
Matthew Yglesias at Vox recently wrote a post about a misleading chart created by the Heritage Foundation that was intended to demonstrate how horribly unfair the U.S. tax system is to rich people. Here’s the chart in question:
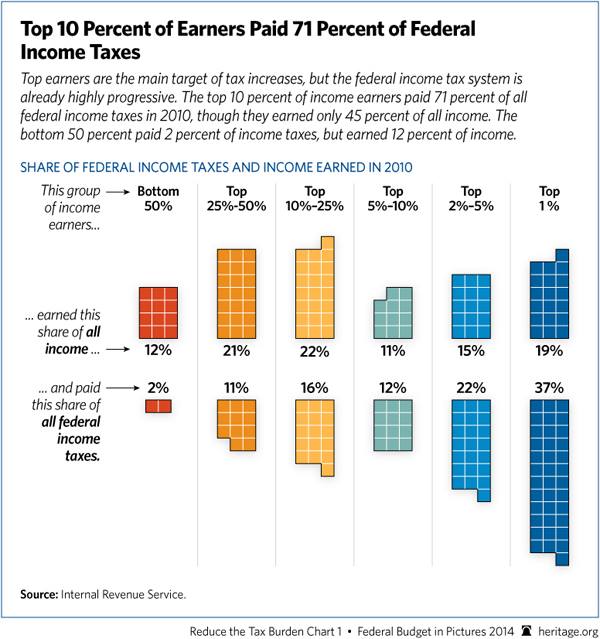
At a glance, it looks like maybe wealthy people have a reason to be stomping their Gucci’d feet and shaking bejeweled fists at the guvment, but as Yglesias points out, the chart cherry picks which taxes to include, neglecting the multiple other taxes that do not support their point, such as payroll taxes and state and local taxes, which tend to disproportionately fall on the poor. Jamie Bernstein points this out as well in her recent article 4 Myths about Taxes, along with several other clarifications about what it means to pay a particular percentage of your income depending on your tax bracket.
But here’s what all the critics of this chart are missing–the opportunities for all of us inherent in the Heritage Foundation’s logic.
Just think about the possibilities of defining reality based on leaving pertinent information out.
For example:
My green car has four tires, a steering wheel, a windshield, and headlights. So does this Jaguar.

Therefore, if we leave out certain factors, I drive a Jaguar. And it works for rich people too! Don’t want to pay high insurance and licensing fees on your Jaguar? Sweet Pinto, my friend.
Or an even closer example. Let’s say I want to get a small business loan, maybe from, I don’t know, a Heritage Foundation board member. It’s totally legit to present my income without including my expenses, right? I would still be factually demonstrating my income. Hell, I’ll even throw in my Jaguar as collateral.
Not convinced? Tell you what. I’ll even pay you back in cash, with hundred dollar bills, the ones with the dead old white guy on them and a 1. And my three-year-old could cosign, with her vast real estate holdings, including a four-bedroom alpine chalet and several railroad and zoo properties. Oh, and a private jet that will teach you the alphabet and how to count.
If I cherry pick well enough, I could probably “prove” that the Heritage Foundation owes me money.
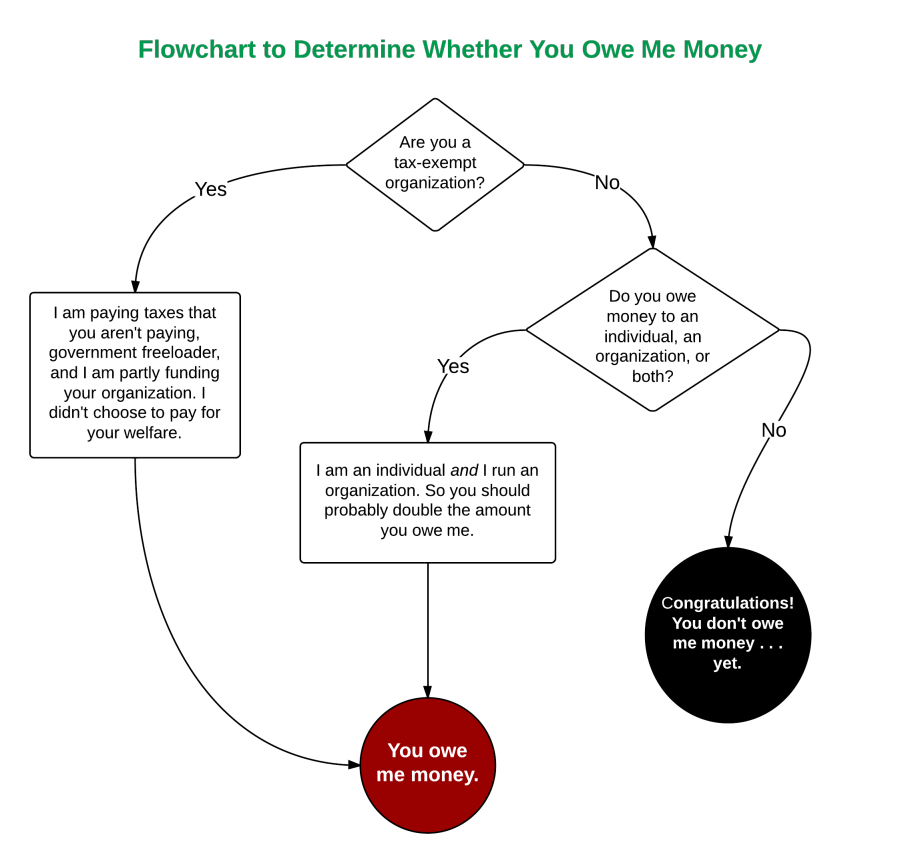
So screw the collateral (although I might still offer the counting jet just as a public service). I should probably send an invoice to the foundation today. But I’m not going to do that, because I am not a con artist. I only play one on Thursdays.


Melanie Mallon,
I used to have a lot of respect for the Heritage Foundation in my conservative days.
Then they probably owe YOU way more than they owe me. :-P
Notice how the brackets get smaller as they go up? The top 1% earns 19% of total income, over 50% more than the bottom 50% combined, averaging 80 times as much income as the half of the total population that is in the bottom 50%. Totally ignoring all the other regressive taxes and fees. (I pay the same car registration fee for my Lamborghini* as you do for your Yugo.)
[*] I wish…
True, even this misleading chart can’t hide the appalling income disparity.
I think licensing varies by state. Our older cars were cheaper to register than our newer ones in Arizona. Not sure about Minnesota because our cars are roughly the same age, about 20 years old, so not a noticeable difference if any.
OK Heritage, i’m convinced, ignore the income tax for now, let’s just make sure all income counts as income! Capital gains can get set back to the same rates as income!