The other day, I Tweeted a link to this Vulture article in which the age of an actor is compared to the age of his female costar at the time of filming, showing that as men age, their female costars seem to stay the same age like a perky, perpetually stacked Dorian Gray. This, for instance, is Harrison Ford:

A few of my Twitter friends wondered what the chart would look like for leading ladies who have had a long career. Because I’m a party animal, last night I got totally crazy and spent like an hour on IMDB just to satisfy your curiosity.
While the Vulture team chose a sampling of ten films for each actor, I didn’t think that was particularly fair and could be subject to bias. So I included every movie in which the actress had a love interest that I could easily deduce if I hadn’t seen the film. Maybe I got some wrong. I don’t know, what does this look like? Good Chart Thursday? No. It’s Bad Chart Thursday. Deal with it.
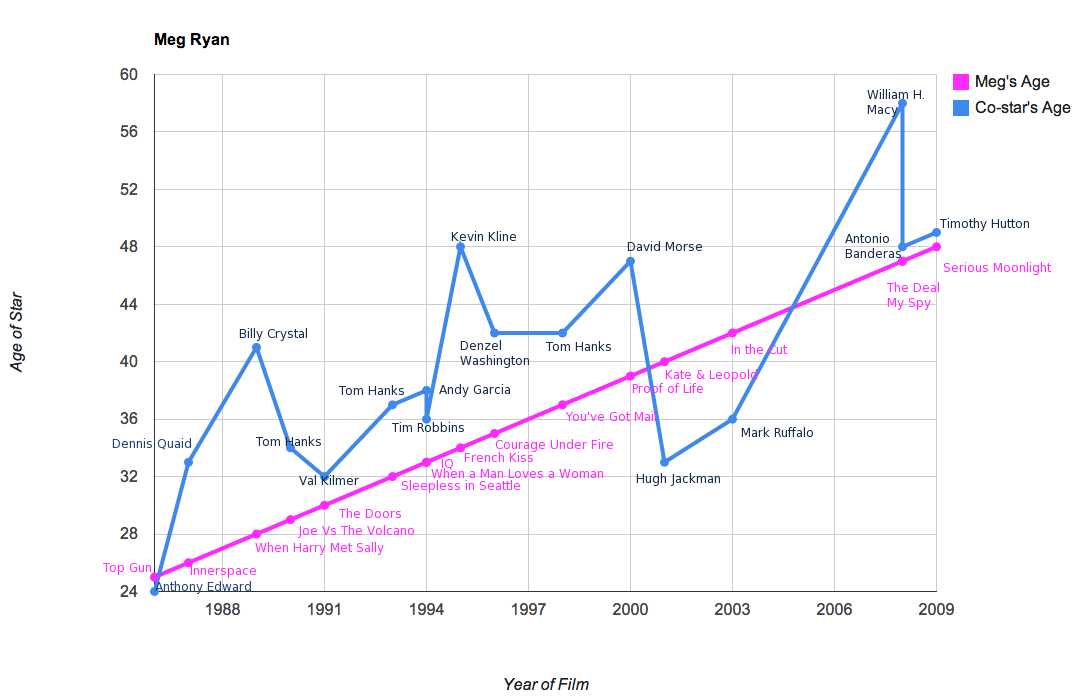
Meg Ryan was the first actress I checked out, thinking that she was the perfect response to the Tom Hanks chart on Vulture.
As you can see, Meg Ryan’s chart clearly resembles Batman climbing up over a ledge, a fact that cannot be ignored in evaluating the data. You can also see that she has many costars who are a decade or more older than her until she hits the age of 40, at which point she starts scoring the sexy older lady roles and boning characters played by the likes of Mark Ruffalo.
If you’re interested, Meg’s mean age in this chart is 35.6 and her costar’s mean age is 39.9 (a difference of 4.3 years). Prior to the age of 40, her mean age is 31.8 and her love interest’s mean age is 37.8 (a difference of 6 years).

You guys, Julia Roberts has been in a lot of movies with male co-stars. A lot. I shoved in as many as I could. The most interesting thing about her chart, I think, is that it betrays a problem with Vulture’s chart. Vulture pointed out that Tom Hanks had never had a love interest outside a decade of his own age, but Julia has costarred with him twice and they have an 11-year difference. So nyah. Unlike Meg, Julia was able to start dating younger men as early as when she was 35.
Also: yikes, Nick Nolte. Yikes.
Julia’s mean age is 31.7 and her love interest’s mean age is 39.7 (a difference of 8 years). Prior to the age of 40, her mean age is 29.3 and her love interest’s mean age is 38.3 (a difference of 9 years).

Finally, I charted the great Meryl Streep. She’s the first one to have a chart to rival the men’s, at least from the age of 46 on (or from 40 on if you discount two outlying data points). You go Meryl Streep!
Still, on average, Meryl Streep costarred with older – sometimes much older, in the case of Clint Eastwood – actors. Her mean age here is 44.6 and her love interest’s mean age is 47 (a difference of 2.4 years). Prior to 40, her mean age is 36.7 and her love interest’s mean age is 43.2 (a difference of 6.5 years).
I could only handle three before I got completely bored of doing this, but I think you can already start to see an interesting trend in how prior to the age of 40, actresses are by and large paired with old men. After the age of 40, they get more roles that partner them with love interests who are younger than they are. Someone else should do an in-depth study of how often those older woman-younger man pairings have the characters’ ages as the driving force of the plot.
Also left unsaid in this chart is how often an actress continues to be cast as the central love interest in a film once she reaches a certain age. Someone with more time on their hands should get on that.


This is the trope namer, the quintessential, the archetypal, the ur-Bad Chart Thursday.
I was thinking about this very thing a couple a days ago watching Silver Linings Playbook, Bradley Cooper is about 37/38 years old, and Jennifer Lawrence is 22 years old. I felt kinda uncomfortable watching their whole relationship develop.
It is so good to be bad…on bad chart day! I wonder what the normal age difference is between men and women in real life relationships? Time for google.
First of all, it is not true that as leading men age, their love interests don’t. This notion would imply that the correlation coefficients should be negligible low, but they are not. Most of them show at least a moderate positive correlation (e.g. 0.21 for Washington, 0.46 for Depp etc.). This means that in general, as the male movie stars age, so do their female counterparts. Not by as much of course, but they still age enough for the correlation to be moderately high.
Second, Rebecca Watson is performing an inappropriate and misleading statistical analysis. She attempts to compare the average age of the female start with the average age of her male counterpart, but this unpaired comparison is highly inappropriate for paired data (which we have here). The correct corresponding way to analyze the data would be to calculate the difference between the female star and the male counterpart for each movie then average that difference before and after 40 (not the difference between the averages as Watson attempts).
“Inappropriate and misleading statistical analysis”, perfect for bad chart Thursday! Makes your brain hurt huh? I found some bad charts of my own after using google on the topic. HA!
I was gonna say–not that these aren’t valid points, but I think someone missed the memo on what “Bad Chart Thursday” is all about…
So like, emilkarlsson, the data’s all there on the charts so you can go ahead and do a paired t test if you like. Knock yourself out. See if that is any more informative than the charts themselves. I doubt it (I think they’re actually very good graphs).
First of all, you seem to completely misunderstand my point: my point is about the statistical inappropriateness of the method, not an attack on the result per se.
Second, you did not respond to any of my criticisms. Do you think it is statistically appropriate to analyze paired data as if they were unpaired? Do you think it is legitimate to say that there is no correlation when, in fact, the correlation is often moderate?
Third, a statistical significance test is inappropriate in this context because the sample size is very low. That means that the statistical power is going to be low and the probability of detecting an existing difference would therefore also be low.
This is definitely the most seriously anyone has ever taken Bad Chart Thursday. I like it.
Yet you make no effort whatsoever to correct your errors. Why is that?
Because I have better things to do than dig through your ragey posts to parse what you’re saying and then spend several more hours redoing charts for a joke post?
Can anything be more correct than a chart which looks like Batman climbing over a ledge?
“Third, a statistical significance test is inappropriate in this context because the sample size is very low. That means that the statistical power is going to be low and the probability of detecting an existing difference would therefore also be low.”
Prove it!
Sure, here is a recent paper on the problem of published in Nature Reviews Neuroscience (impact factor 30+). It focuses on how low sample sizes / low statistical power influences neuroscientific research in particular, but the statistical arguments are generally applicable.
Button, Katherine S., Ioannidis, John P. A., Mokrysz, Claire, Nosek, Brian A., Flint, Jonathan, Robinson, Emma S. J., & Munafo, Marcus R. (2013). Power failure: why small sample size undermines the reliability of neuroscience. Nat Rev Neurosci, 14(5), 365-376. doi: 10.1038/nrn3475
emilkarlsson, that’s not what I meant. I think we are missing a teachable moment here.
The onus is on you to retrieve the data from the charts and rework it in the way suggested.
If you think it makes any material difference in view of the following:
1 It was a joke post, centered on the charts, not the statistics
2 Rebecca threw in the means as an afterthought “if you’re interested”
3 You do not “attack the result per se”
4 The charts themselves show the results clearly enough and the figures add very little
For non statisticians watching, I am asking emilkarlsson to do the following
Look at each point on the charts and tabulate the ages on a spreadsheet – female then male
Calculate the deltas by subtracting female from male
Calculate the mean and standard deviation of the differences
Count the points n
Calculate the t statistic which is mean on sd all divided by root (n-1)
If t is >2 the difference is significant at the 95% level.
We already know the result by looking at the chart – the men are older.
Repeat with data split at age 40 – this would be interesting
This whole process would take about 30 minutes per chart, mostly on the first step – the rest is easy.
As emilkarlsson has calculated correlation coefficients, I think he has already tabulated the data.so the exercise should be easy.
I don’t disagree with his statistical points at all, simply their relevance.
Except I disagree with his final point – I think the value of the t statistic itself will tell us if there is insufficient data.
Speaking of teachable moments, one bad thing about the charts is that women are pink and boys are blue!
Ha ha, yeah, that was a last-minute decision to make the charts resemble the original Vulture charts as much as possible without putting effort into it.
Rebecca, I thought that was it – I like your thinking!
Given your druthers what would it be? Orange and green or something?
BTW I got my brackets wrong for the t formula above, t= mean /(sd/root (n-1))
lol omg thank you for the laugh
Just wanted to say that in Meryl Streep’s chart there’s a “serious” mistake. Kevin Bacon is so very much not the male love interest. David Strathairn is. Kevin Bacon is the bad guy.
I think that you should count Peter MacNicol as the love interest in Sophie’s Choice. Kevin Kline was her husband, but the movie is about the duty she feels vs. the love she feels.
This looks like a lot of work. Very interesting.