As a geology graduate student, I find the role that computers play in my research varies greatly. In the field, I don’t use computers at all. If I brought along my laptop, there would be less room for samples in my backpack. At most, I use a handheld or tablet PC GPS to record sampling locations. In the lab, computers are important tools for running mass spectrometers and reducing data. Still, much labwork can be done without the aid of computers. However, in the geophysical modeling work I’ve been doing recently, I am finding computers and computer knowledge essential.
My primary advisor (in his late 60s) checks email on an ancient Macintosh. He prints his email to paper, keeps folders of paper copies of emails, and scrawls responses in pencil on his emails. He sometimes replies to emails himself. Often, though, he writes something (by hand) and has his administrative assistant or myself type up the responses. This same advisor also edits research papers by hand, using a red pencil, scissors, and tape. He was very impressed when I stole images from a website and put them in a powerpoint presentation. Unfortunately, he isn’t significantly more impressed when I spend ten hours making a single figure in Illustrator.
For a semester-long class project I’m working on, however, I am working with an advisor who is extremely computer saavy. He has a 30″ computer screen on his desk and another 20″ screen on the table beside his desk. He owns a cluster of supercomputers that reside in the basement underneath his office. He recently bought so much equipment from Apple (about $10,000 worth) that they sent him a free monitor, ipod, and other goodies to thank him for his large purchase. This advisor is fluent in several computer languages, though FORTRAN is dear to his heart. He runs almost everything through UNIX.
I fall somewhat in-between these two end-member advisors when it comes to my computer skills. I’m competent enough with basic programs such as Powerpoint, Word, Excel, Photoshop, and Illustrator. I’m addicted to email, and I’m very competent with google searches and finding my way through library databases. I can put together a halfway-decent website with a little help from a program such as Dreamweaver. However, when it comes to navigating UNIX or LINUX-based systems I am somewhat outside of my comfort zone. A single high school course on C++ is the extent of my formal computer programming training. Even programming in MATLAB, the easiest sort of programming to do, is a challenge for me. I am not a computer programmer or modeler.
Well, at least not until recently… I figure it’s time. I’ve been an MIT student for nearly a year now. It’s time I learn how to speak UNIX, before they kick me out for being too computer un-saavy.
Two months ago I threw myself into computer modeling headfirst. Every spring at Woods Hole there is a geology seminar called “Geodynamics.” The theme of this seminar is different every year. This year, the theme is continental margins. Every week there is a speaker. Additionally, the students are expected to work on a term-long research project (related to continental margins) with a Woods Hole faculty member and present this project at the end of the semester. Students are supposed to pick a project that is outside of their comfort zone. Students who are geophysicists are encouraged to play with some chemicals in the lab or count some formanifera for paleoclimate work. Chemists are encouraged to leave behind their labs and learn how to work with seismic or gravity data. For me, geophysics and computer modeling are both outside my comfort zone. So, a project using computers to make geophysical models was ideal for my geodynamics project.
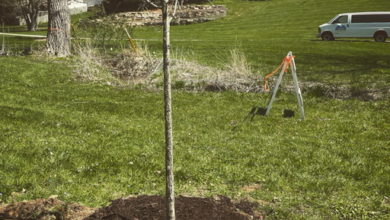
For my geodynamics project, I’m using computer models to investigate different styles of rifting in the Gulf of California. I won’t go into the details of the project here, but I’ll just say that I am making models of the thermal and crustal structure of transects across the Gulf. For these transects, we don’t really know what the crust and mantle below look like. We only have bathymetry and gravity data. From these structures, I create an artificial gravity profile. I then compare this profile with the actual gravity profile (from ship-based gravimeters or satellite altimetry data) to see if my models of the crust and mantle are physically viable. Understanding the nature of the crust and mantle in the Gulf is important because the composition of the crust and mantle have an effect on how the Gulf is rifting and forming a new continental margin.
The research is exciting, and I’m finally getting some results now… which is good as I have to give a presentation on my research project tomorrow afternoon! Progress all along has been somewhat slow and with a steep learning curve. However, considering that two months ago I didn’t know how to make a new directory in my UNIX terminal, let alone create complex gravity models, I think I’m doing fairly well. I still find UNIX and FORTRAN frustrating, at times, but hopefully my learning curve will flatten out some as I become more familair.
At the very least, I’ve learned how to create some pretty pictures. Below is one model for the Farallon spreading center of the Gulf of California. The upper part of the picture contains the gravity profiles. The black data is satellite data while the blue is the modeled gravity. The lower part of the picture shows the crustal and thermal structure created in my model. The different colors represent different densities: less-dense sediments (green), moderately dense crust (browns), and dense mantle (oranges).
My plan for my talk tomorrow? A little background on the Gulf and my model, then several more of these pretty pictures.


Way to go, Evelyn. As I've said before, I find the details of your work and education fascinating.
Most people have pretty stereotypical ideas of just what a scientist is and does. Your very accessible descriptions of the science involved in your field go a long way to defeating misconceptions.
I also applaud your willingness to get outside your "comfort zone"; those who can synthesize multiple approaches / disciplines are too few in any field. If, as I hope, you continue to popularize science one way or another, a varied academic background will definitely aid that.
Hooray for pretty pictures!
Whenever I learn some new graphing tool, I end up trying to shoehorn graphs in anywhere I can manage. I did it with Visio while I was working on my Senior Design project, and more recently at work I've been messing with graphviz and sticking the results absolutely everywhere, even where text alone would suffice.
Some sort of aphorism about hammers and nails applies to this phenomenon, I think.
So is your model totally FORTRAN-based? If so, mad props! The top graph looks a bit MATLAB-y to me, though.
You measure Gravity in milliGallons? %-9
Oh, and you've got an "un-saavy" up there. ;)
The font on the graphs doesn't look quite MATLAB-esque. I'd guess that they came from a different plotting package.
MATLAB isn't an easy sort of programming in my book. Heck, I'm not sure I'd call it programming. It's great for chewing on matrices, and you can do some loops if you really try, but the moment I had to do something actually program-like in my thesis work, all sorts of design flaws reared up to attack me. MATLAB isn't a programming language; it's a matrix-manipulation package with some control flow features stuffed in a bag on the side.
For example, I one had to do some processing on several data sets (outputs of the same simulation program run with different parameters). I had to make two or three graphs for each data set in the batch, and while all the graphs were formatted the same way, the captions and legends on the graphs had to be different for each one. This graph was for zero magnetic field, this one was for 0.2 tesla, the next for 0.4 tesla, etc.
No problem, I thought. I'll just stick all the captions in an array, and loop over the array with a simple for loop.
Nope. The program didn't run.
Soon enough, I puzzled out that in MATLAB, if you make an array of strings, all the strings have to be the same length. Why? Because everything is kludged in on top of matrix manipulation! A programming language can't be "easy" if you have to worry about such stupidities every time you turn around.
Wow. That was a geeky rant, even for me. Tune in next time, when I describe my experiences with R, Octave and the GNU Scientific Library.
MATLAB is silly, but I love it anyway. I was always amused by the way that there is a built-in function to do pretty much anything. You almost never have to write your own, although you do end up wasting a lot of time trying to work out the silly nitpicky bits.
Like I recall having to pad signals with zeros when doing FFTs? It's been a while, but there was some silly but extremely common situation where you definitely had to manually pad your array. Shouldn't that honestly be built into the function?
Oy vey.
Good luck with the talk, Evy!
I love venturing outside of my comfort zone a little… when I'm too comfortable, I get bored. I'm glad you were able to do so and get positive results! I hope the presentation went well.
There is one thing I wanted to point out – you misused the term "learning curve." It's not really a big deal, I think the misuse is actually more popular than the actual meaning. A learning curve refers to something becoming easier the more you do it – so a steep curve means you pick it up faster, and the shallow curve means it takes longer.
Just nitpickiness on my part. :)
That is one of the best correlations between model and real data I've ever seen! I wish the genetic data I play with would behave that sensibly sometimes.
You know a lot of my geek colleagues are converting to mac. You get a very pretty and user friendly system with all the power of a unix/linux system under the hood. I'm still sticking to ubuntu linux for now.
Geology divides into 3 – hard rock, soft rock and no rock. The latter category includes computer modeling, remote sensing, geophysics, planetary geology. The only thing common between them is using digitized data as input and output.
Nice curve. Does heat flow have much effect on density?